Comparing Vote Markets on Binance Smart Chain and Ethereum
this pdf file.
How did users interact with the platform?
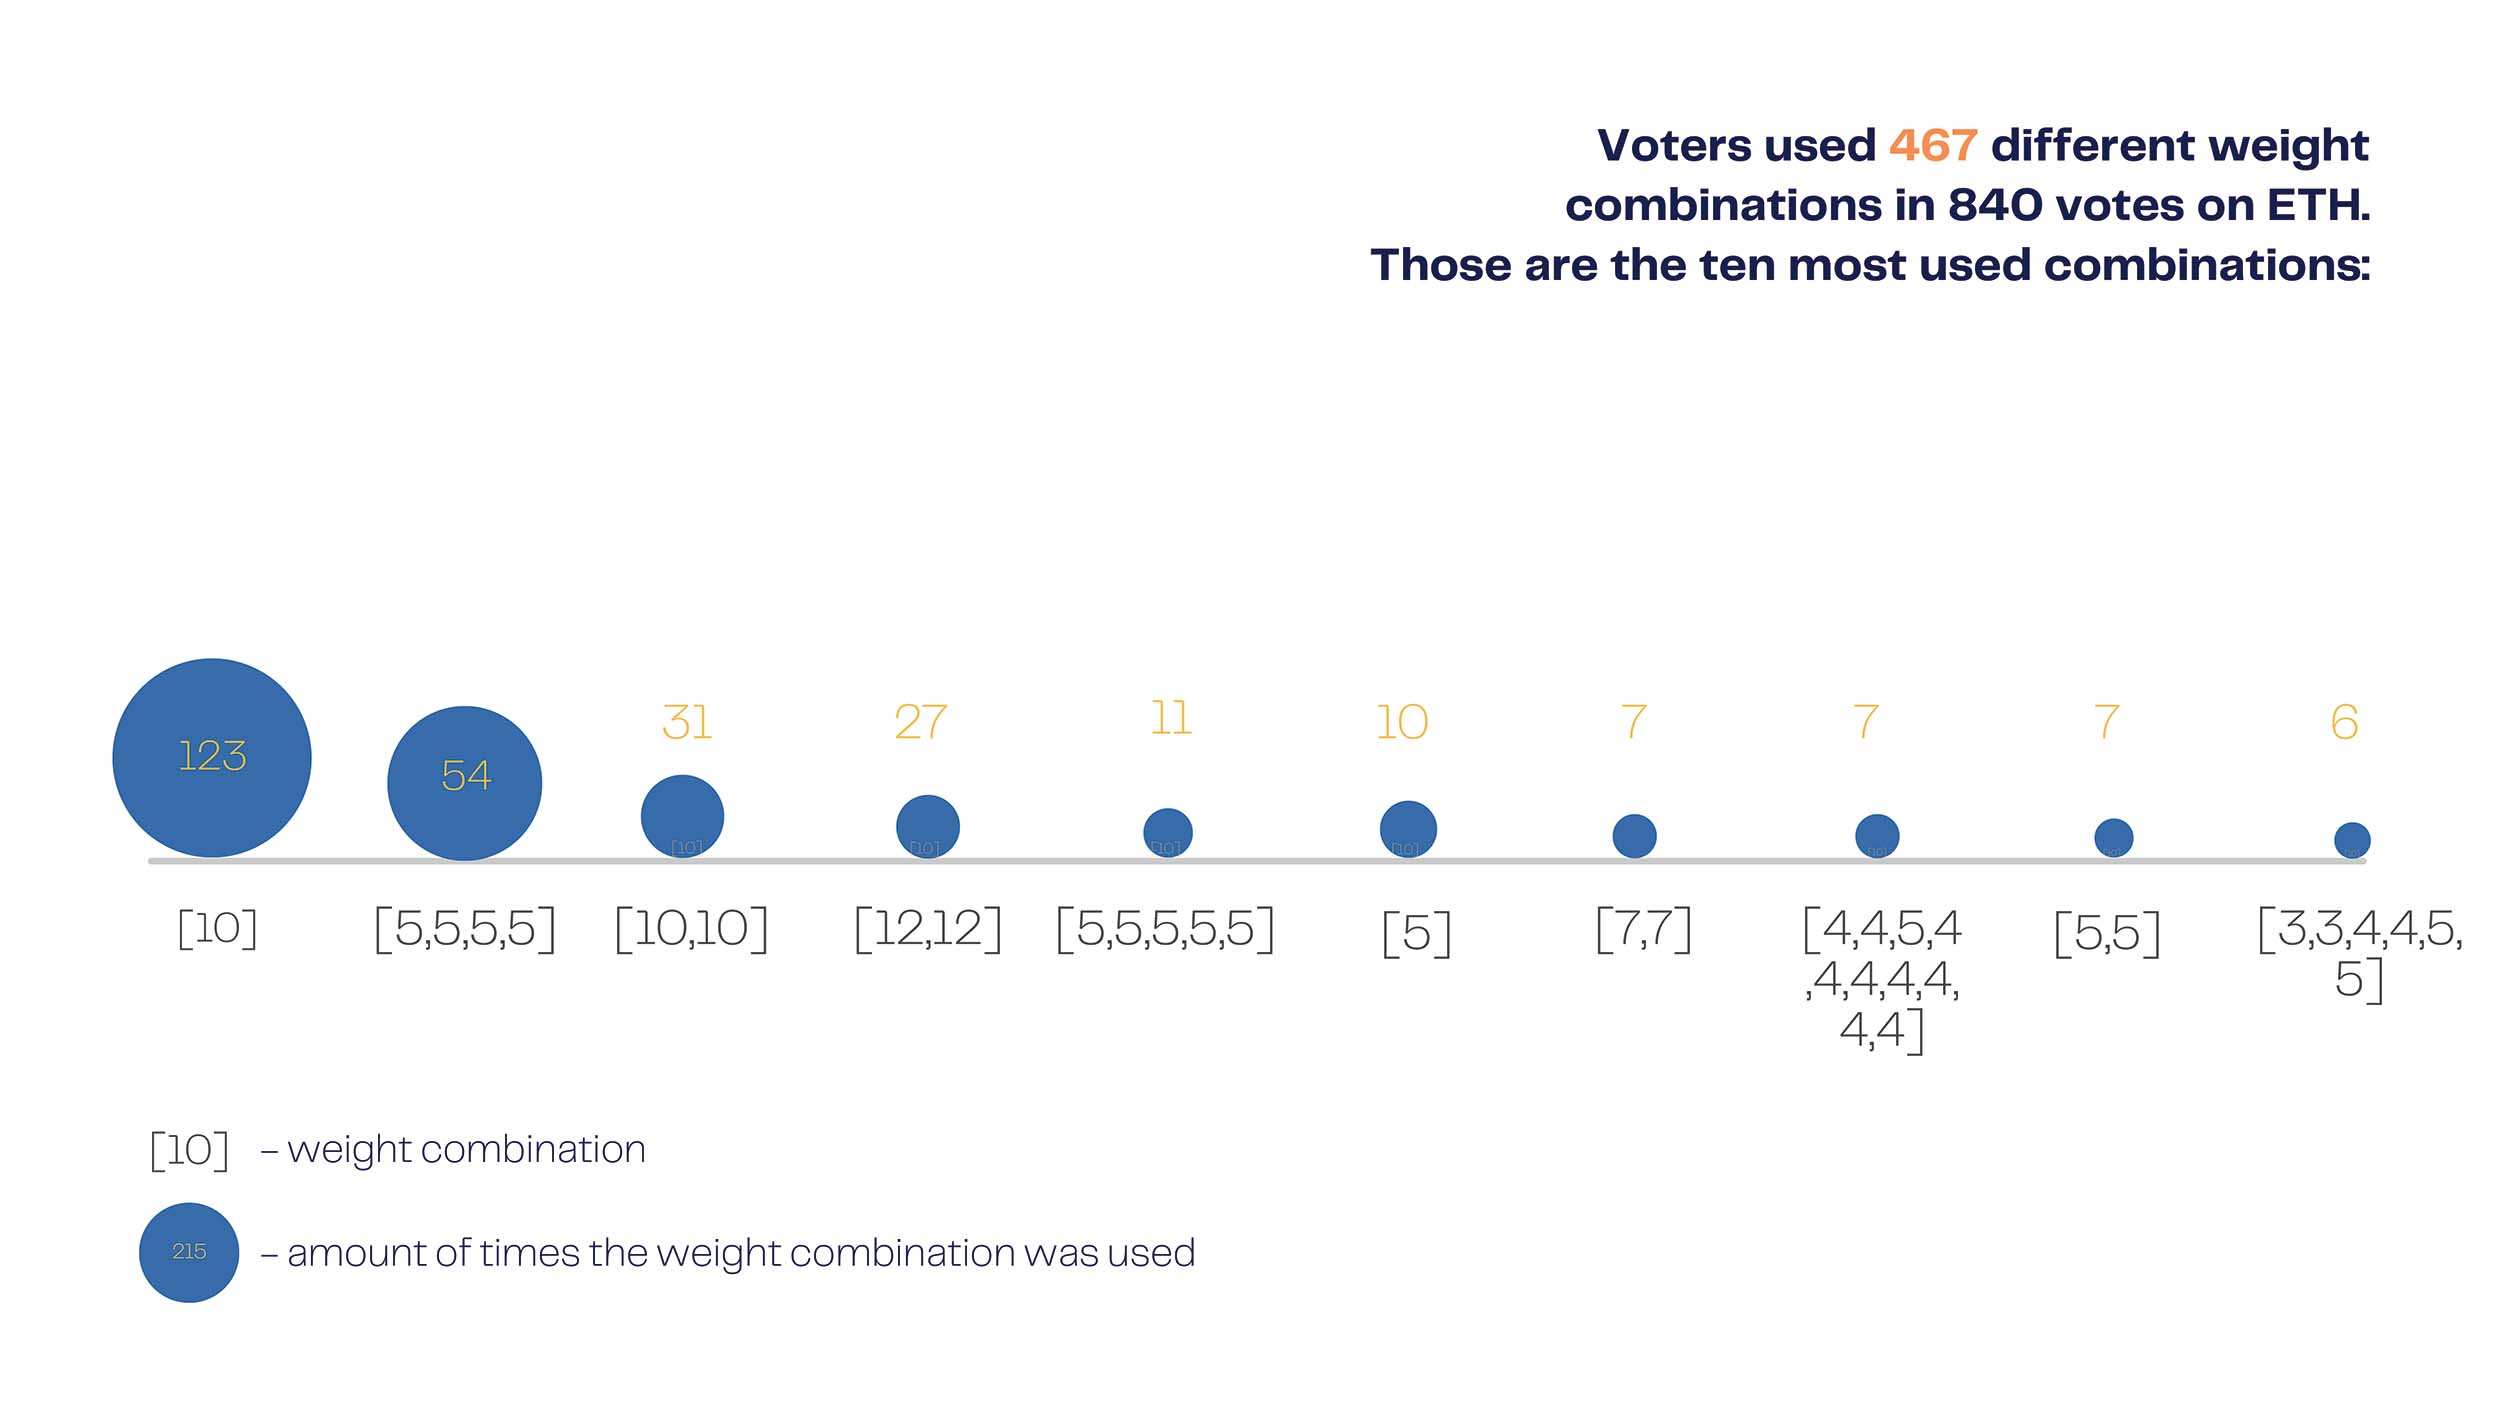
How did voters apply Quadratic Voting?
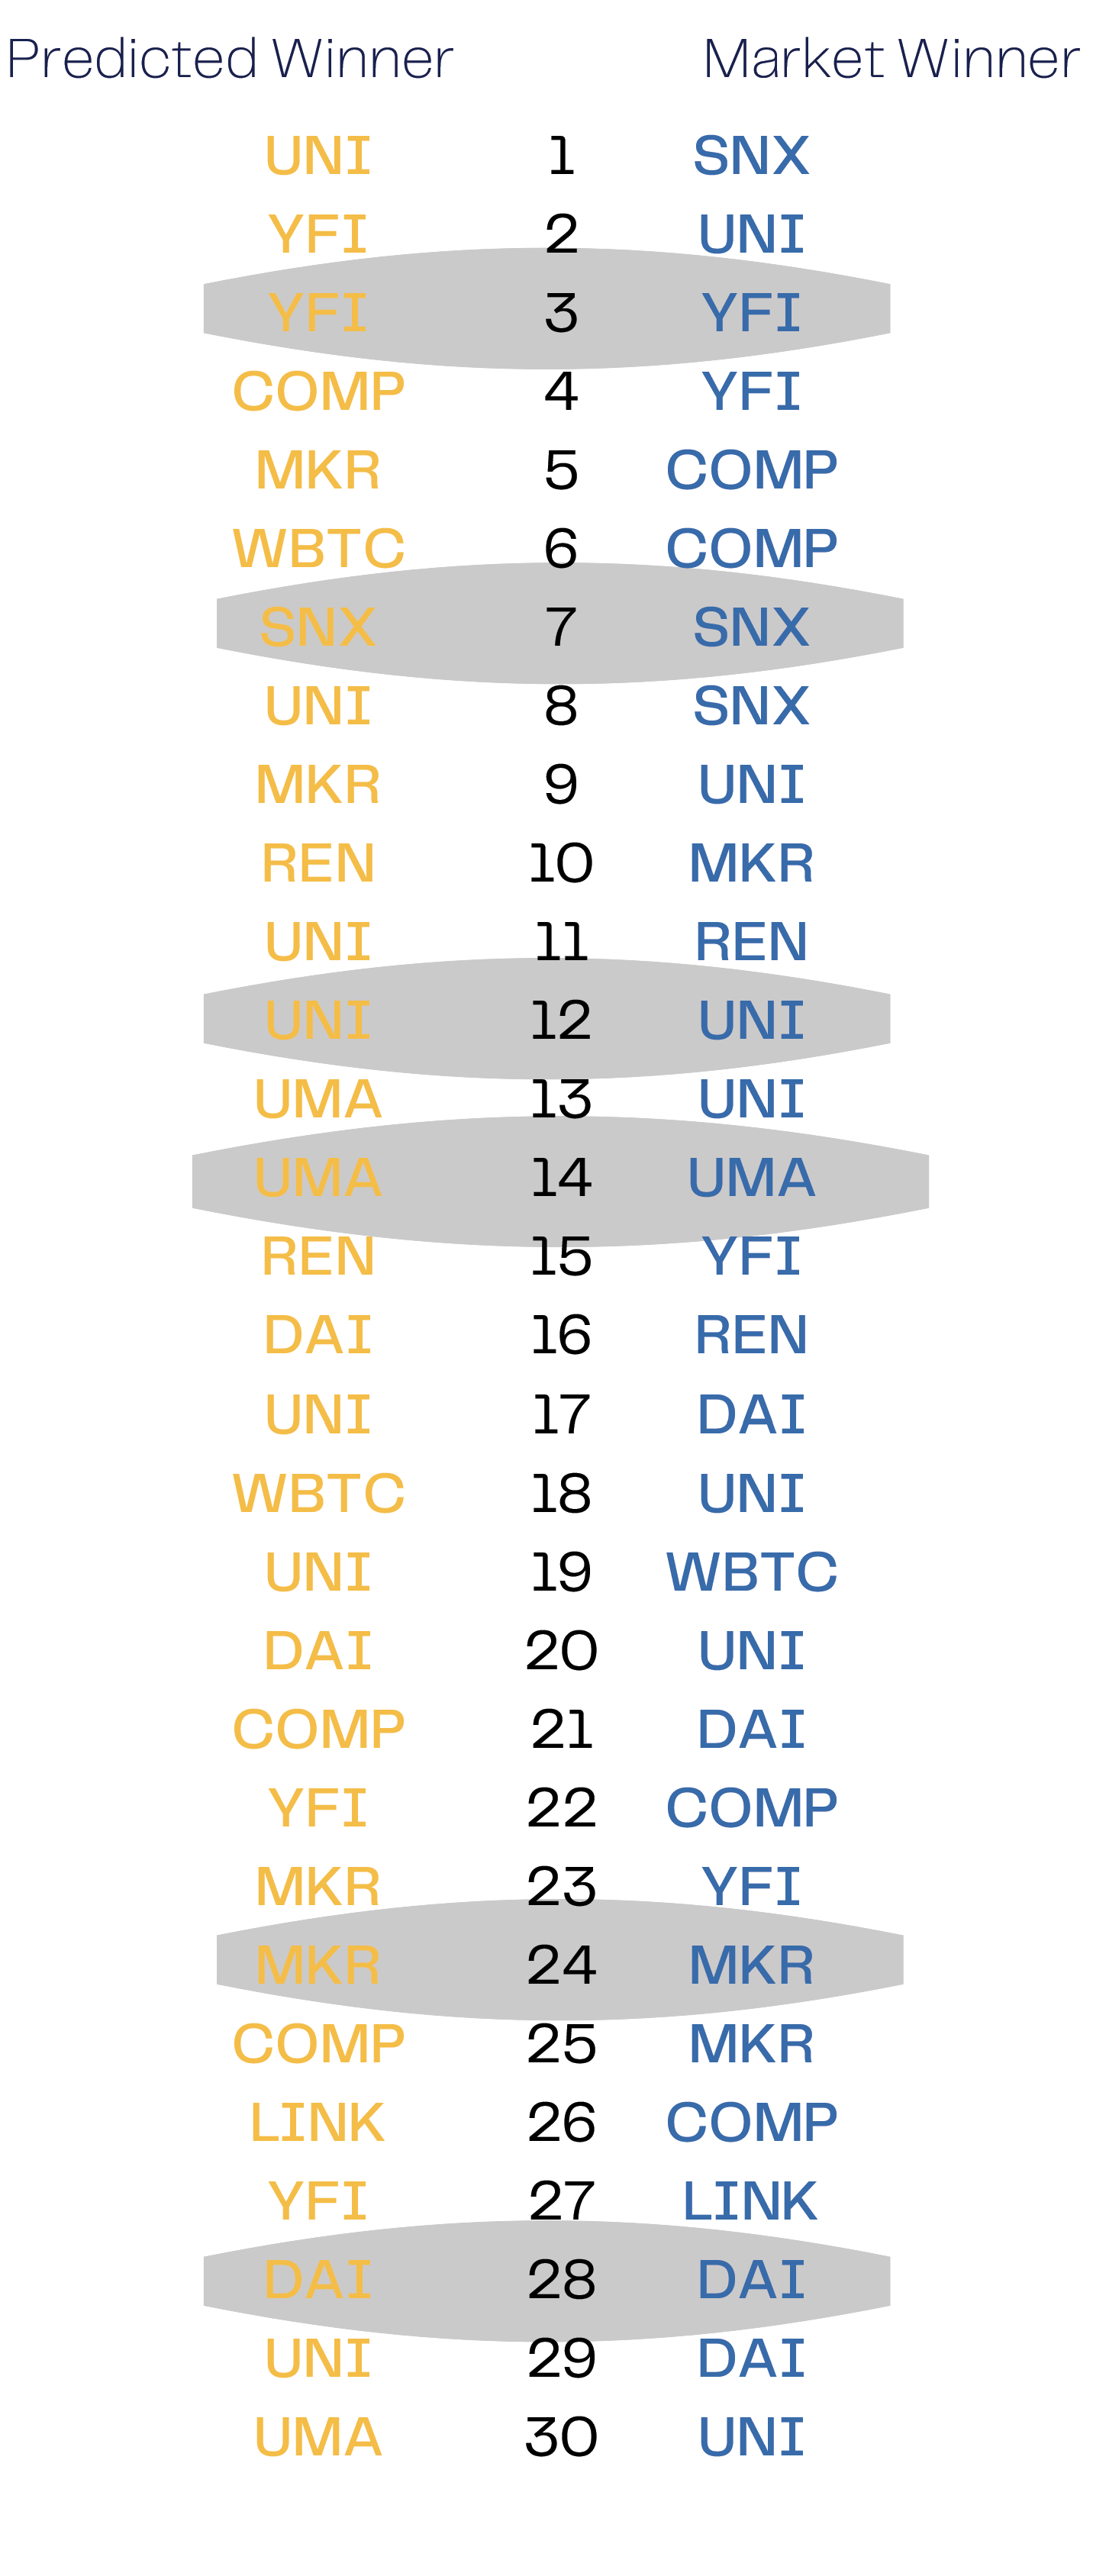
What makes a user a successful predictor?
What is the predictive power of markets.vote?
What is Quadratic Voting?
Number of votes |
Cost in Tokens |
|---|---|
1 |
1 |
2 |
4 |
3 |
9 |
4 |
16 |
5 |
25 |
6 |
36 |
7 |
49 |
8 |
64 |
9 |
81 |
10 |
100 |
How does the markets.vote work?
Voter Activity
Chain |
BSC |
ETH |
|---|---|---|
Total voters |
151 |
248 |
Total votes |
7994 |
840 |
Total voterIDs |
654 |
318 |
Average votes per round |
265 |
28 |
Average user would mint |
4 voterIDs |
2 voterIDs |
Adoption Curve
ETH
BSC
Voter Turnout
ETH
BSC
VoterIDs per Wallet
ETH
BSC
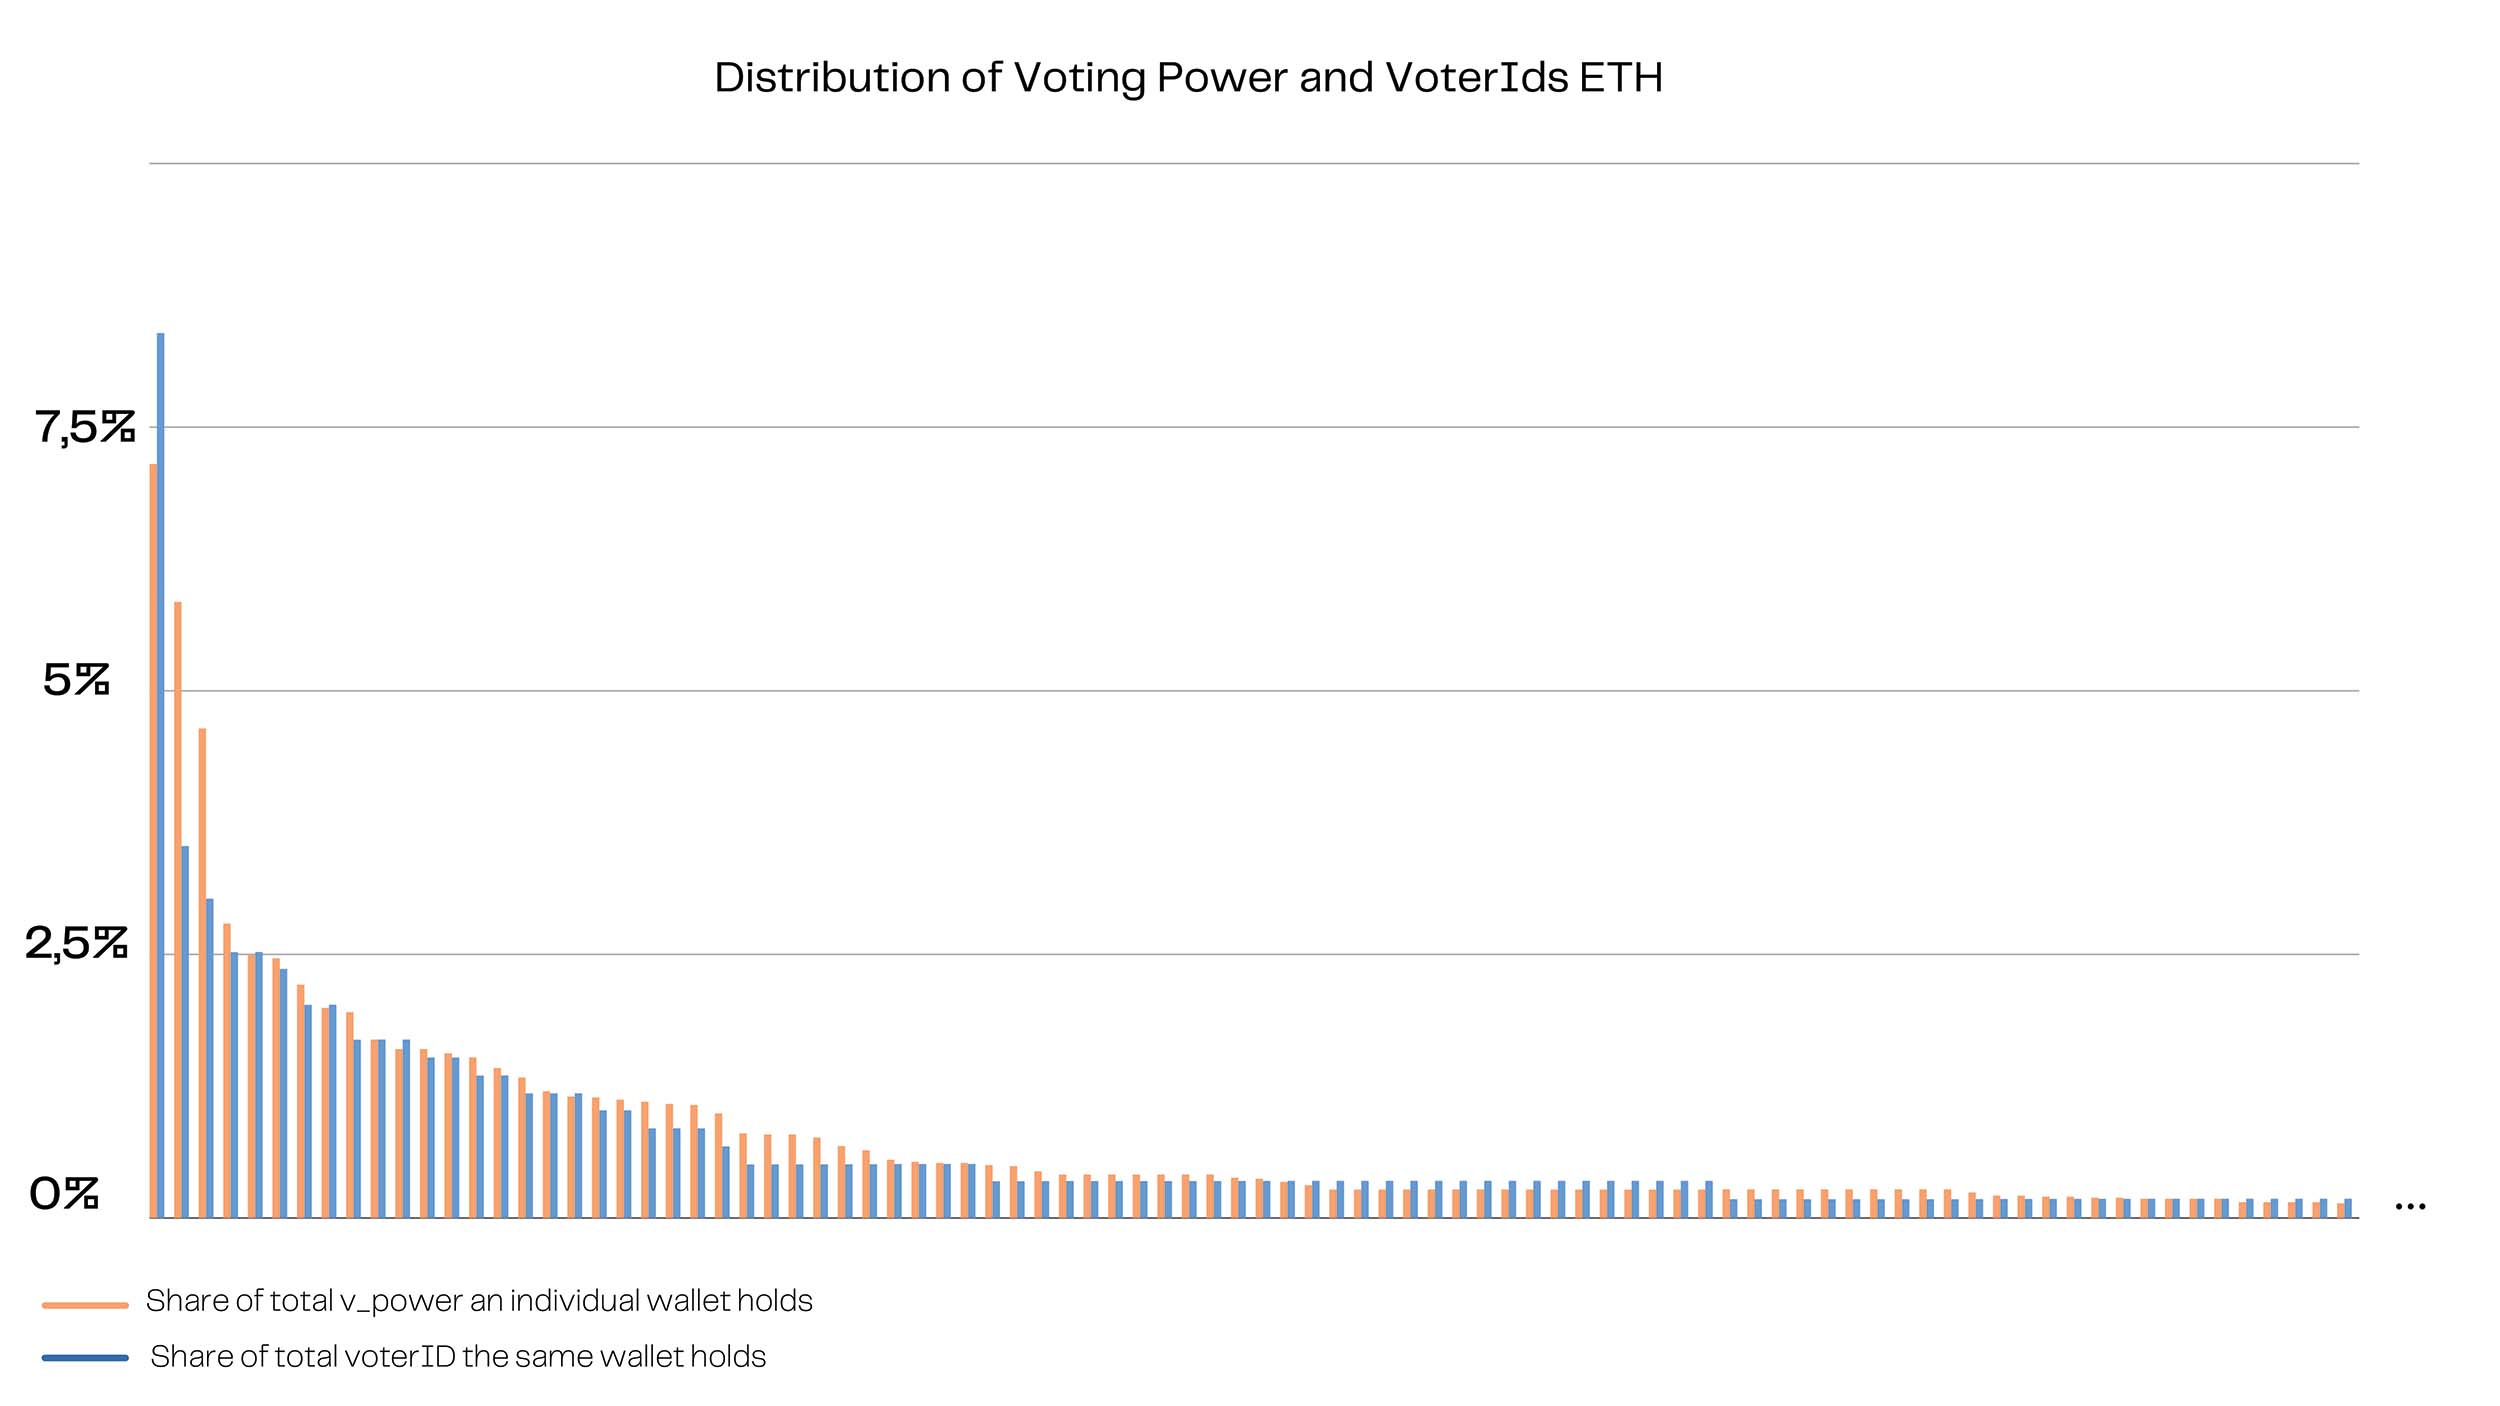
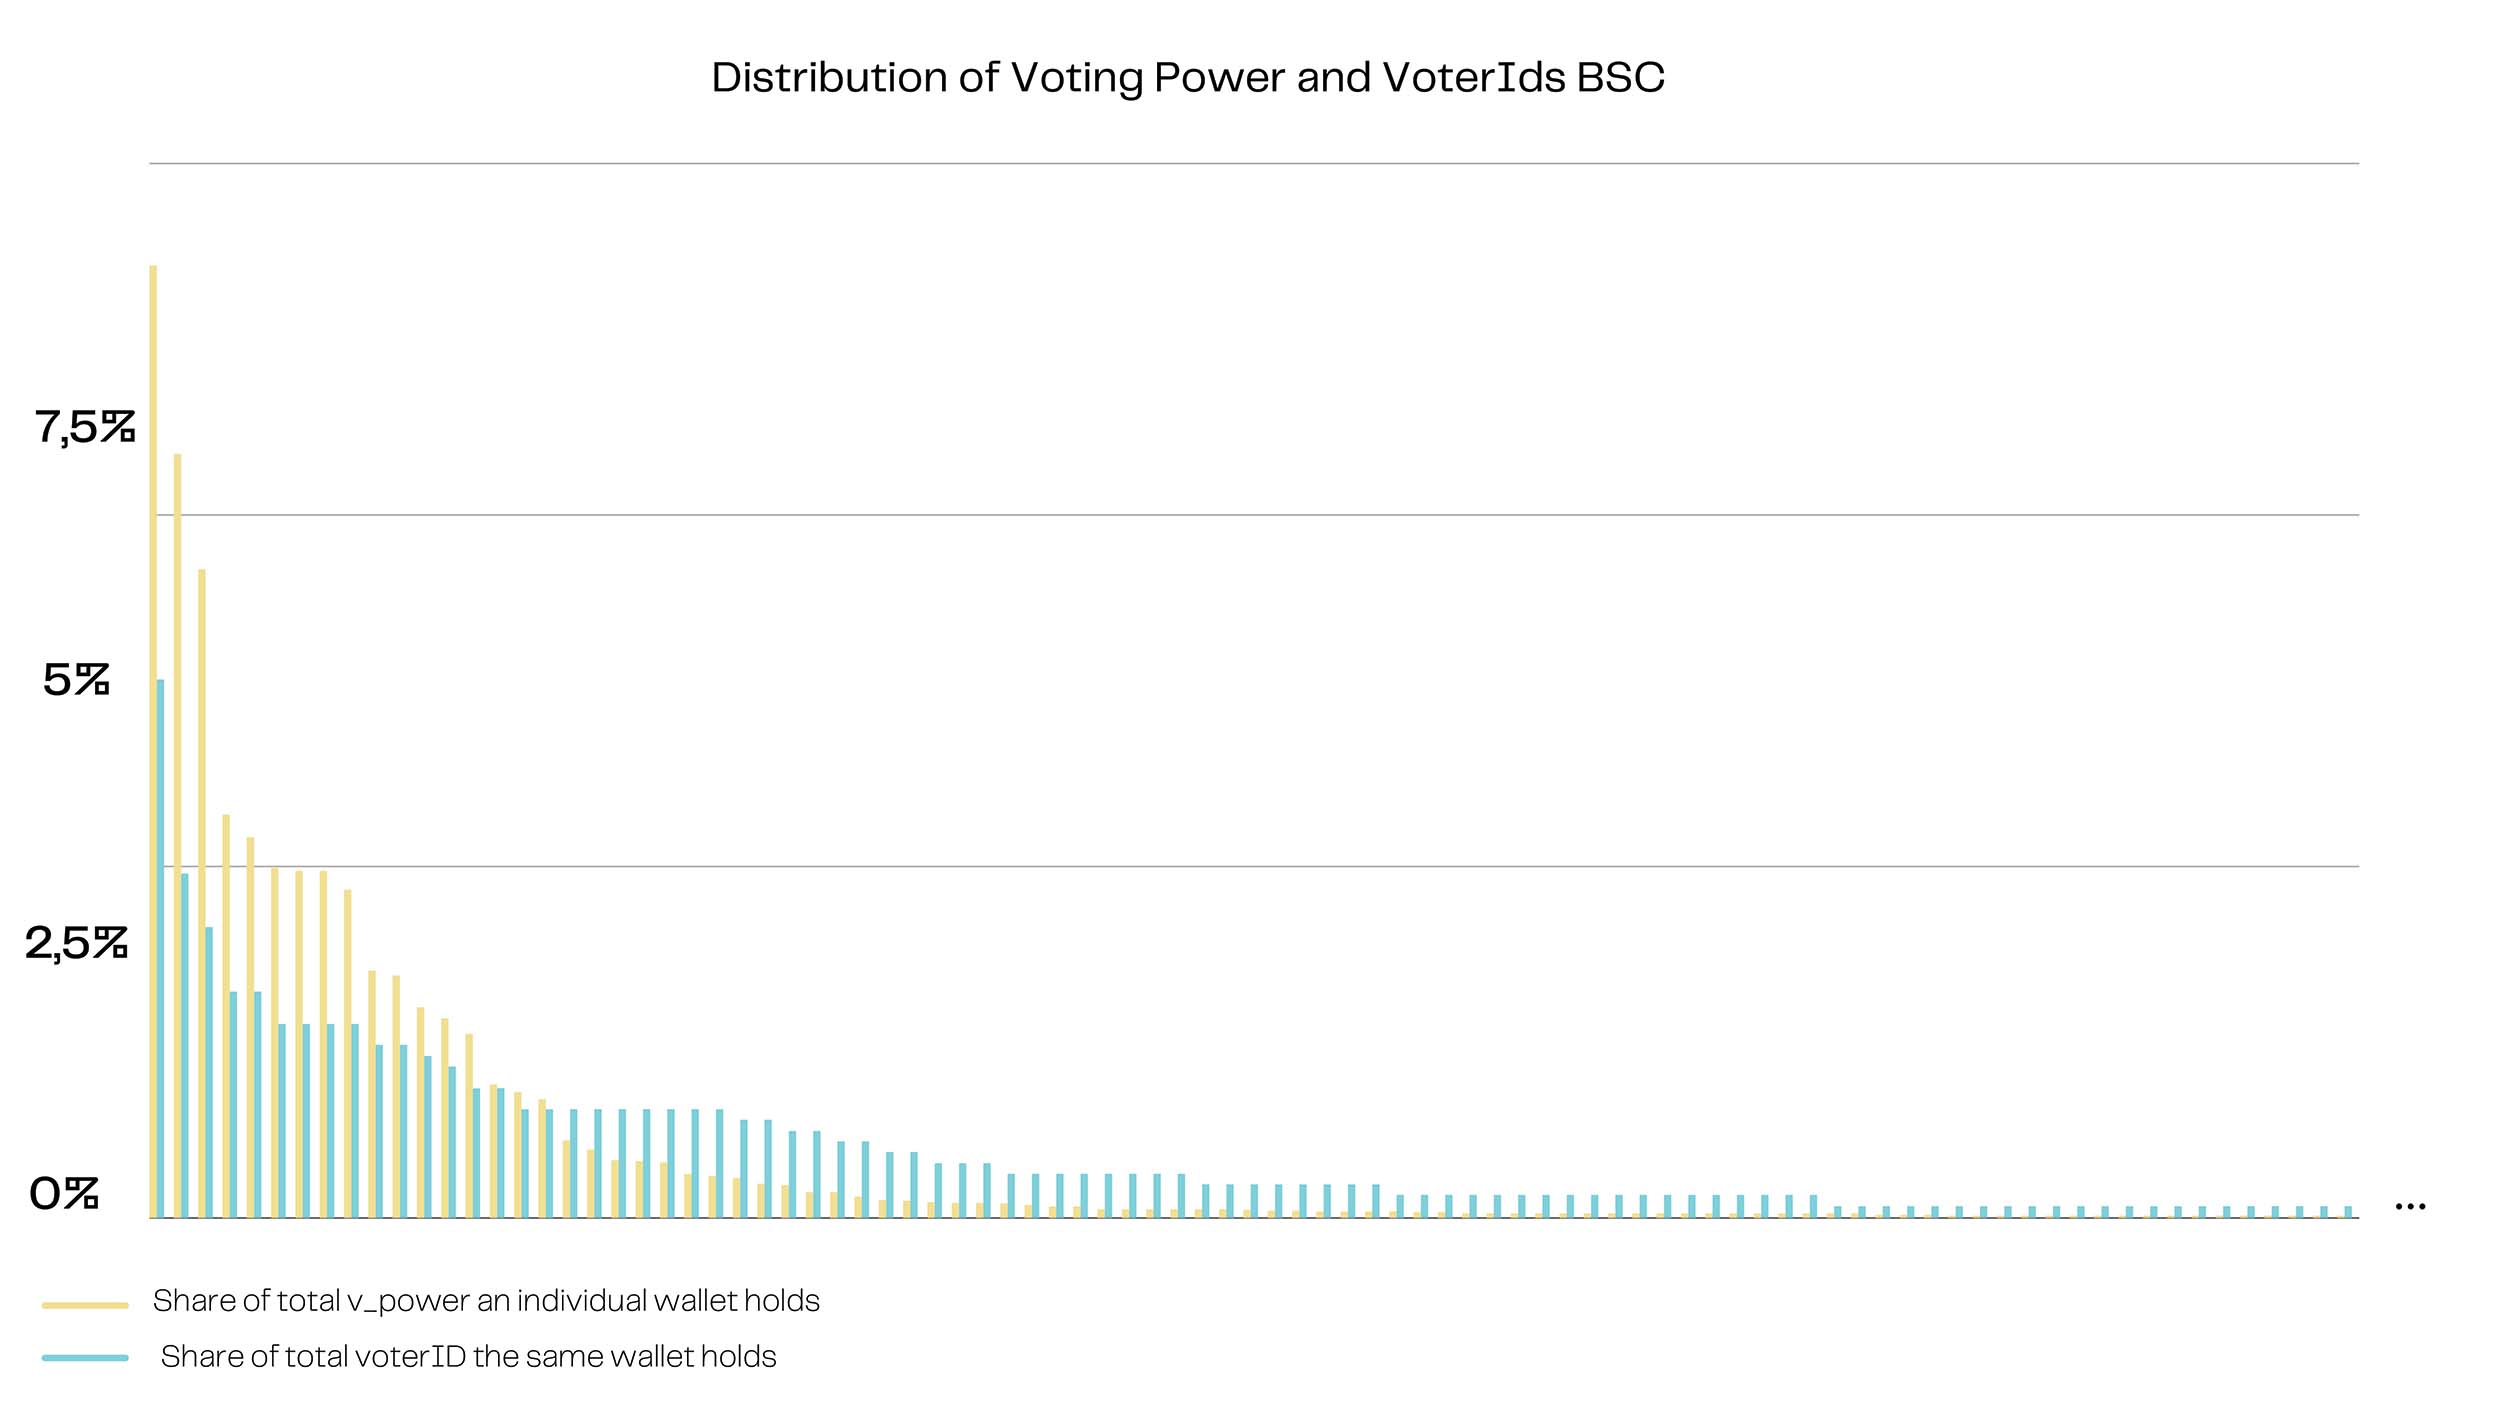
Distribution of Voting Power and VoterIDs
ETH
BSC
How did voters apply QV?
ETH

On average, voters used 58% of their voting power per vote on ETH.
100, 200 & 99 were the three most used amounts of voting power.
On average, voters made 2 choices per vote on ETH: With 10, 1, 2 being the most used coin choices.
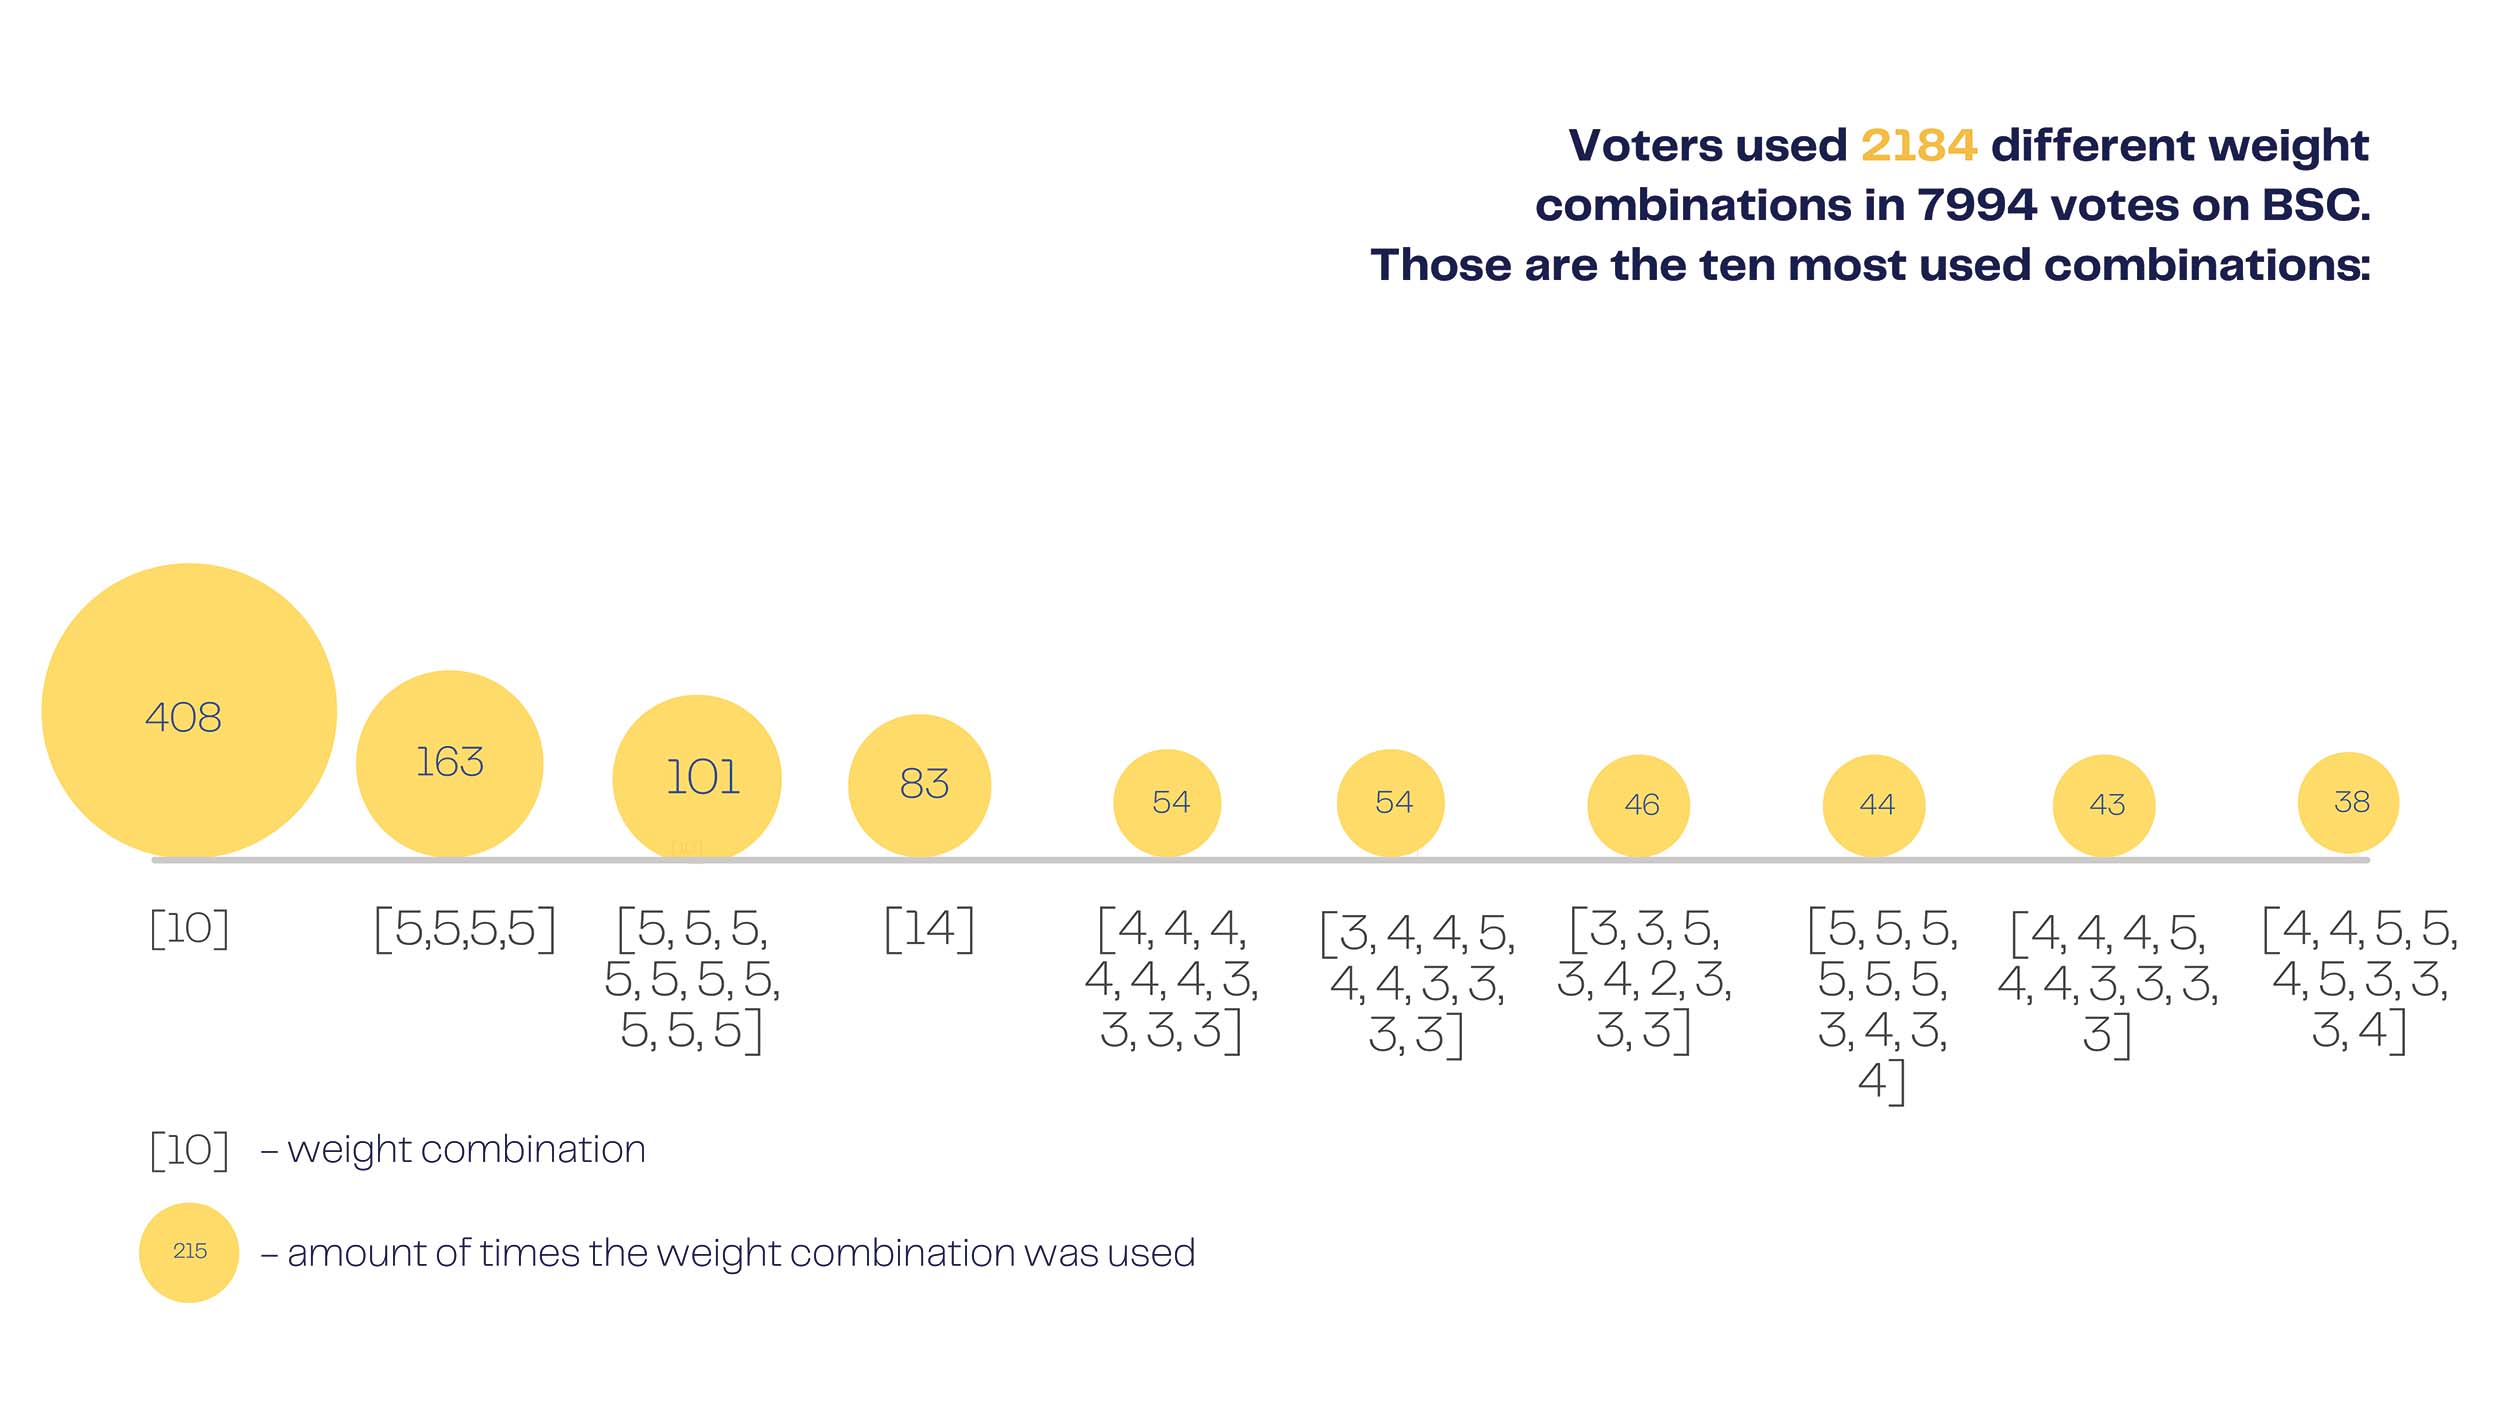
BSC

On average, voters used 40% of their voting power per vote on BSC.
100, 99 & 97 were the three most used amounts of voting power.
On average, voters made 10 choices per vote on BSC, choosing all ten coins in one vote.
Coin clairvoyants
Top 3 wallets with most Voting Power on BSC chain |
|||
|---|---|---|---|
Address |
0x34…39EA |
0xE3…D58f |
0x8E…734b |
Voting Power |
45 515 |
36 498 |
30 994 |
# of voterID |
50 |
32 |
27 |
# of rounds participated |
30 |
28 |
26 |
% of voting power used |
36.9% |
33.3% |
29.9% |
AVG # of choices |
9.6 |
9.6 |
9.8 |
3 most weight combination used |
[3,3,4,1,4,4,2,2,3,4] |
[3,3,3,2,4,3,3,3,3,4] |
[5,5,5,5,5,5,3,4,3,4] |
[7,7,7,8,8,6,5,6,7] |
[4,3,3,2,3,3,3,3,4,3] |
[10,8,10,7,10,10,8,8,8,8] |
|
[9,9,9,9,9,9,3,9,9] |
[4,4,5,5,4,4,3,6,5,4] |
[4,4,4,5,4,4,3,3,3,3] |
|
Top 3 wallets with most Voting Power on ETH chain |
|||
|---|---|---|---|
Address |
0x34…39EA |
0x6e…dDec |
0x67…e640 |
Voting Power |
5400 |
4406 |
3501 |
# of voterID |
50 |
5 |
15 |
# of rounds participated |
3 |
26 |
16 |
% of voting power used |
95.9% |
45.9% |
61.3% |
AVG # of choices |
4.1 |
3.7 |
9.9 |
3 most weight combination used |
[5,5,5,5] |
[10,10] |
[4,4,5,4,4,4,4,4,4,4] |
[5,5,5,5,5] |
[12,12] |
[4,4,4,4,4,4,4,4,4,4] |
|
[10] |
[3,3,4,3,3,3,3,3,3,3] |
||
Top 3 Voting Power Earners on BSC |
|||
|---|---|---|---|
Address |
0x34…39EA |
0xE3…D58f |
0x8E…734b |
Bought Voting Power |
5000 |
3200 |
2700 |
Earned Voting Power |
40 515 |
33 298 |
28 294 |
% Increase |
8.1% |
10.4% |
10.4% |
On BSC the Top 3 Earners are the same wallets with most Voting Power |
|||
|---|---|---|---|
# of rounds participated |
30 |
28 |
26 |
% of voting power used |
36.9% |
33.3% |
29.9% |
AVG # of choices |
9.6 |
9.6 |
9.8 |
3 most weight combination used |
[3,3,4,1,4,4,2,2,3,4] |
[3,3,3,2,4,3,3,3,3,4] |
[5,5,5,5,5,5,3,4,3,4] |
[7,7,7,8,8,6,5,6,7] |
[4,3,3,2,3,3,3,3,4,3] |
[10,8,10,7,10,10,8,8,8,8] |
|
[9,9,9,9,9,9,3,9,9] |
[4,4,5,5,4,4,3,6,5,4] |
[4,4,4,5,4,4,3,3,3,3] |
|
Top 3 Voting Power Earners on ETH |
|||
|---|---|---|---|
Address |
0x6e…dDec |
0xDc…CA7D |
0xB3…6B7C |
Bought Voting Power |
500 |
200 |
100 |
Earned Voting Power |
3906 |
1074 |
469 |
% Increase |
781.2% |
537% |
375% |
How did the most successful voters used the vote markets? |
|||
|---|---|---|---|
# of rounds participated |
26 |
25 |
20 |
% of voting power used |
45.9% |
47.5% |
45.3% |
AVG # of choices |
3.7 |
5.8 |
9.7 |
3 most weight combination used |
[10,10] |
[5,5,5,5] |
[EACH VOTE A DIFFERENT COMBINATION] |
[12,12] |
[+48 DIFFERENT COMBINATIONS] |
||
[10] |
|||
Top 3 VoterIDs BSC |
|||
|---|---|---|---|
VoterID |
54 |
61 |
121 |
Voting Power |
3475 |
2903 |
2628 |
How did the most successful VoterIDs used the vote markets? |
|||
|---|---|---|---|
# of rounds participated |
25 |
22 |
27 |
% of voting power used |
21.5% |
20.6% |
26.9% |
AVG # of choices |
4.3 |
4 |
9.3 |
3 most weight combination used |
[EACH VOTE A DIFFERENT COMBINATION] |
[EACH VOTE A DIFFERENT COMBINATION] |
[EACH VOTE A DIFFERENT COMBINATION] |
Top 3 VoterIDs ETH |
|||
|---|---|---|---|
VoterID |
195 |
1 |
197 |
Voting Power |
2021 |
1226 |
1056 |
How did the most successful VoterIDs used the vote markets? |
|||
|---|---|---|---|
# of rounds participated |
23 |
27 |
23 |
% of voting power used |
39% |
28.4% |
42.7% |
AVG # of choices |
3.6 |
7.6 |
3.6 |
3 most weight combination used |
[EACH VOTE A DIFFERENT COMBINATION] |
[EACH VOTE A DIFFERENT COMBINATION] |
[EACH VOTE A DIFFERENT COMBINATION] |
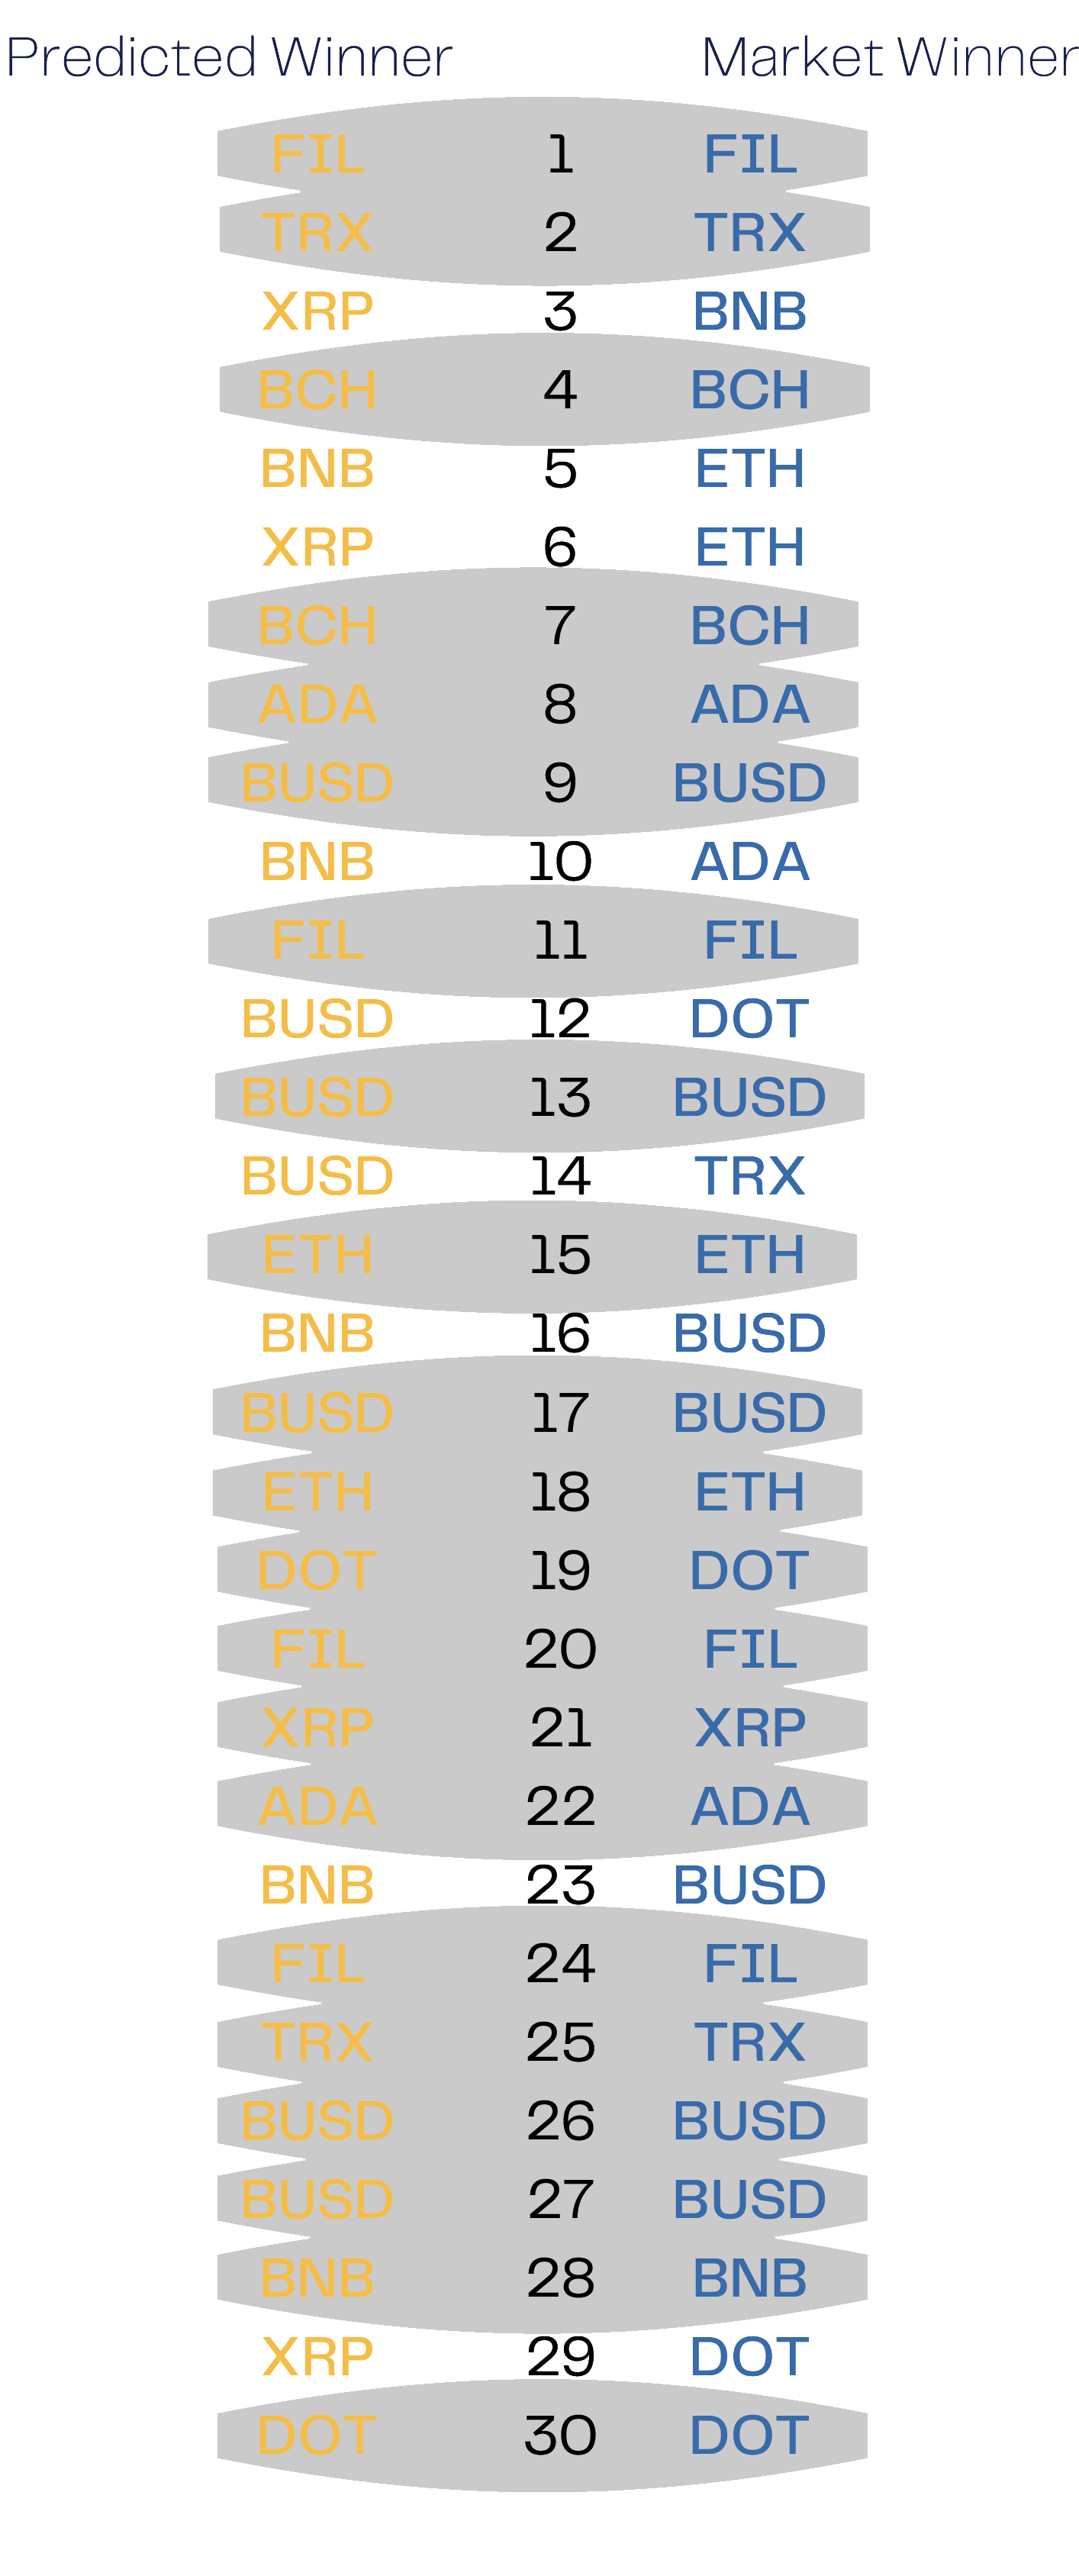
Market predictions
BSC
ETH