A report on the Vote Markets
September 2021
this pdf file.
How did users interact with the platform?
How did voters apply Quadratic Voting?
What makes a user a successful predictor?
What is the predictive power of markets.vote?
What is Quadratic Voting?
Number of votes |
Cost in Tokens |
|---|---|
1 |
1 |
2 |
4 |
3 |
9 |
4 |
16 |
5 |
25 |
6 |
36 |
7 |
49 |
8 |
64 |
9 |
81 |
10 |
100 |
How does the markets.vote work?
Voter Activity
How did users interact with vote markets? |
|
|---|---|
Total voters |
298 |
Total votes |
1379 |
Total voterIDs |
597 |
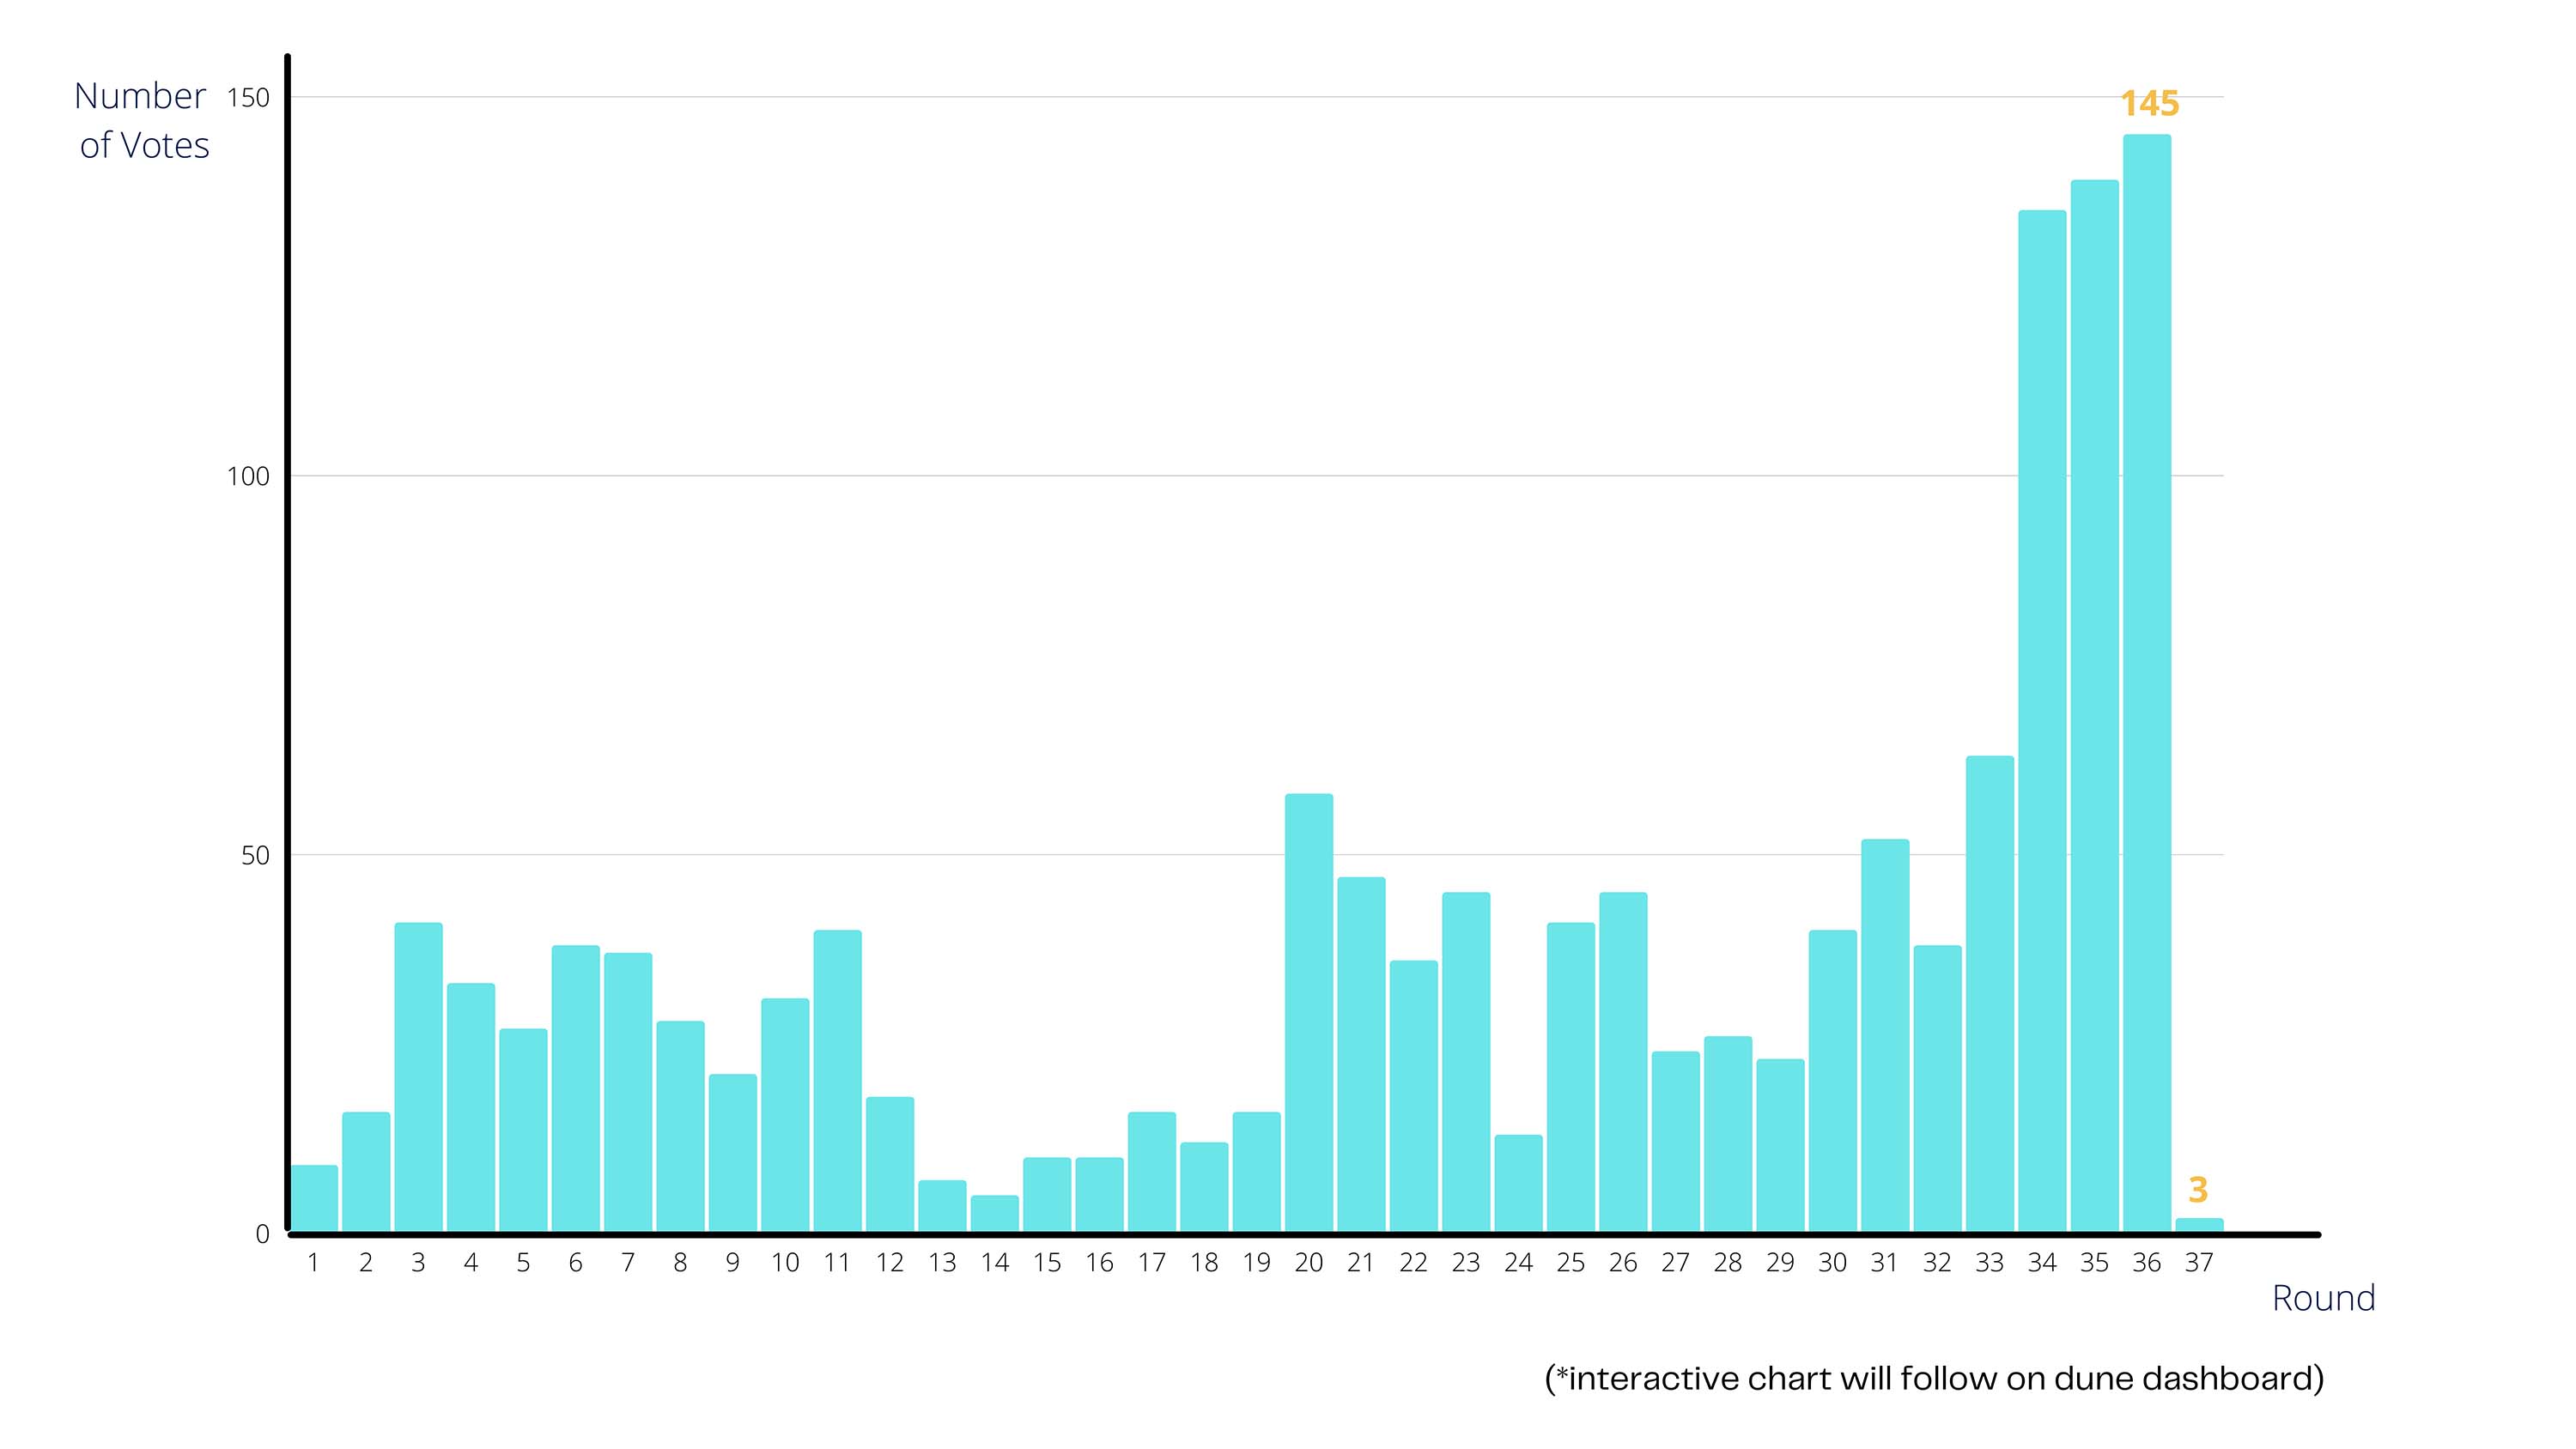
Average votes per round |
38 |
Average user would mint |
2 voterIDs |
No voterID has ever been transfered |
|
Voter turnout
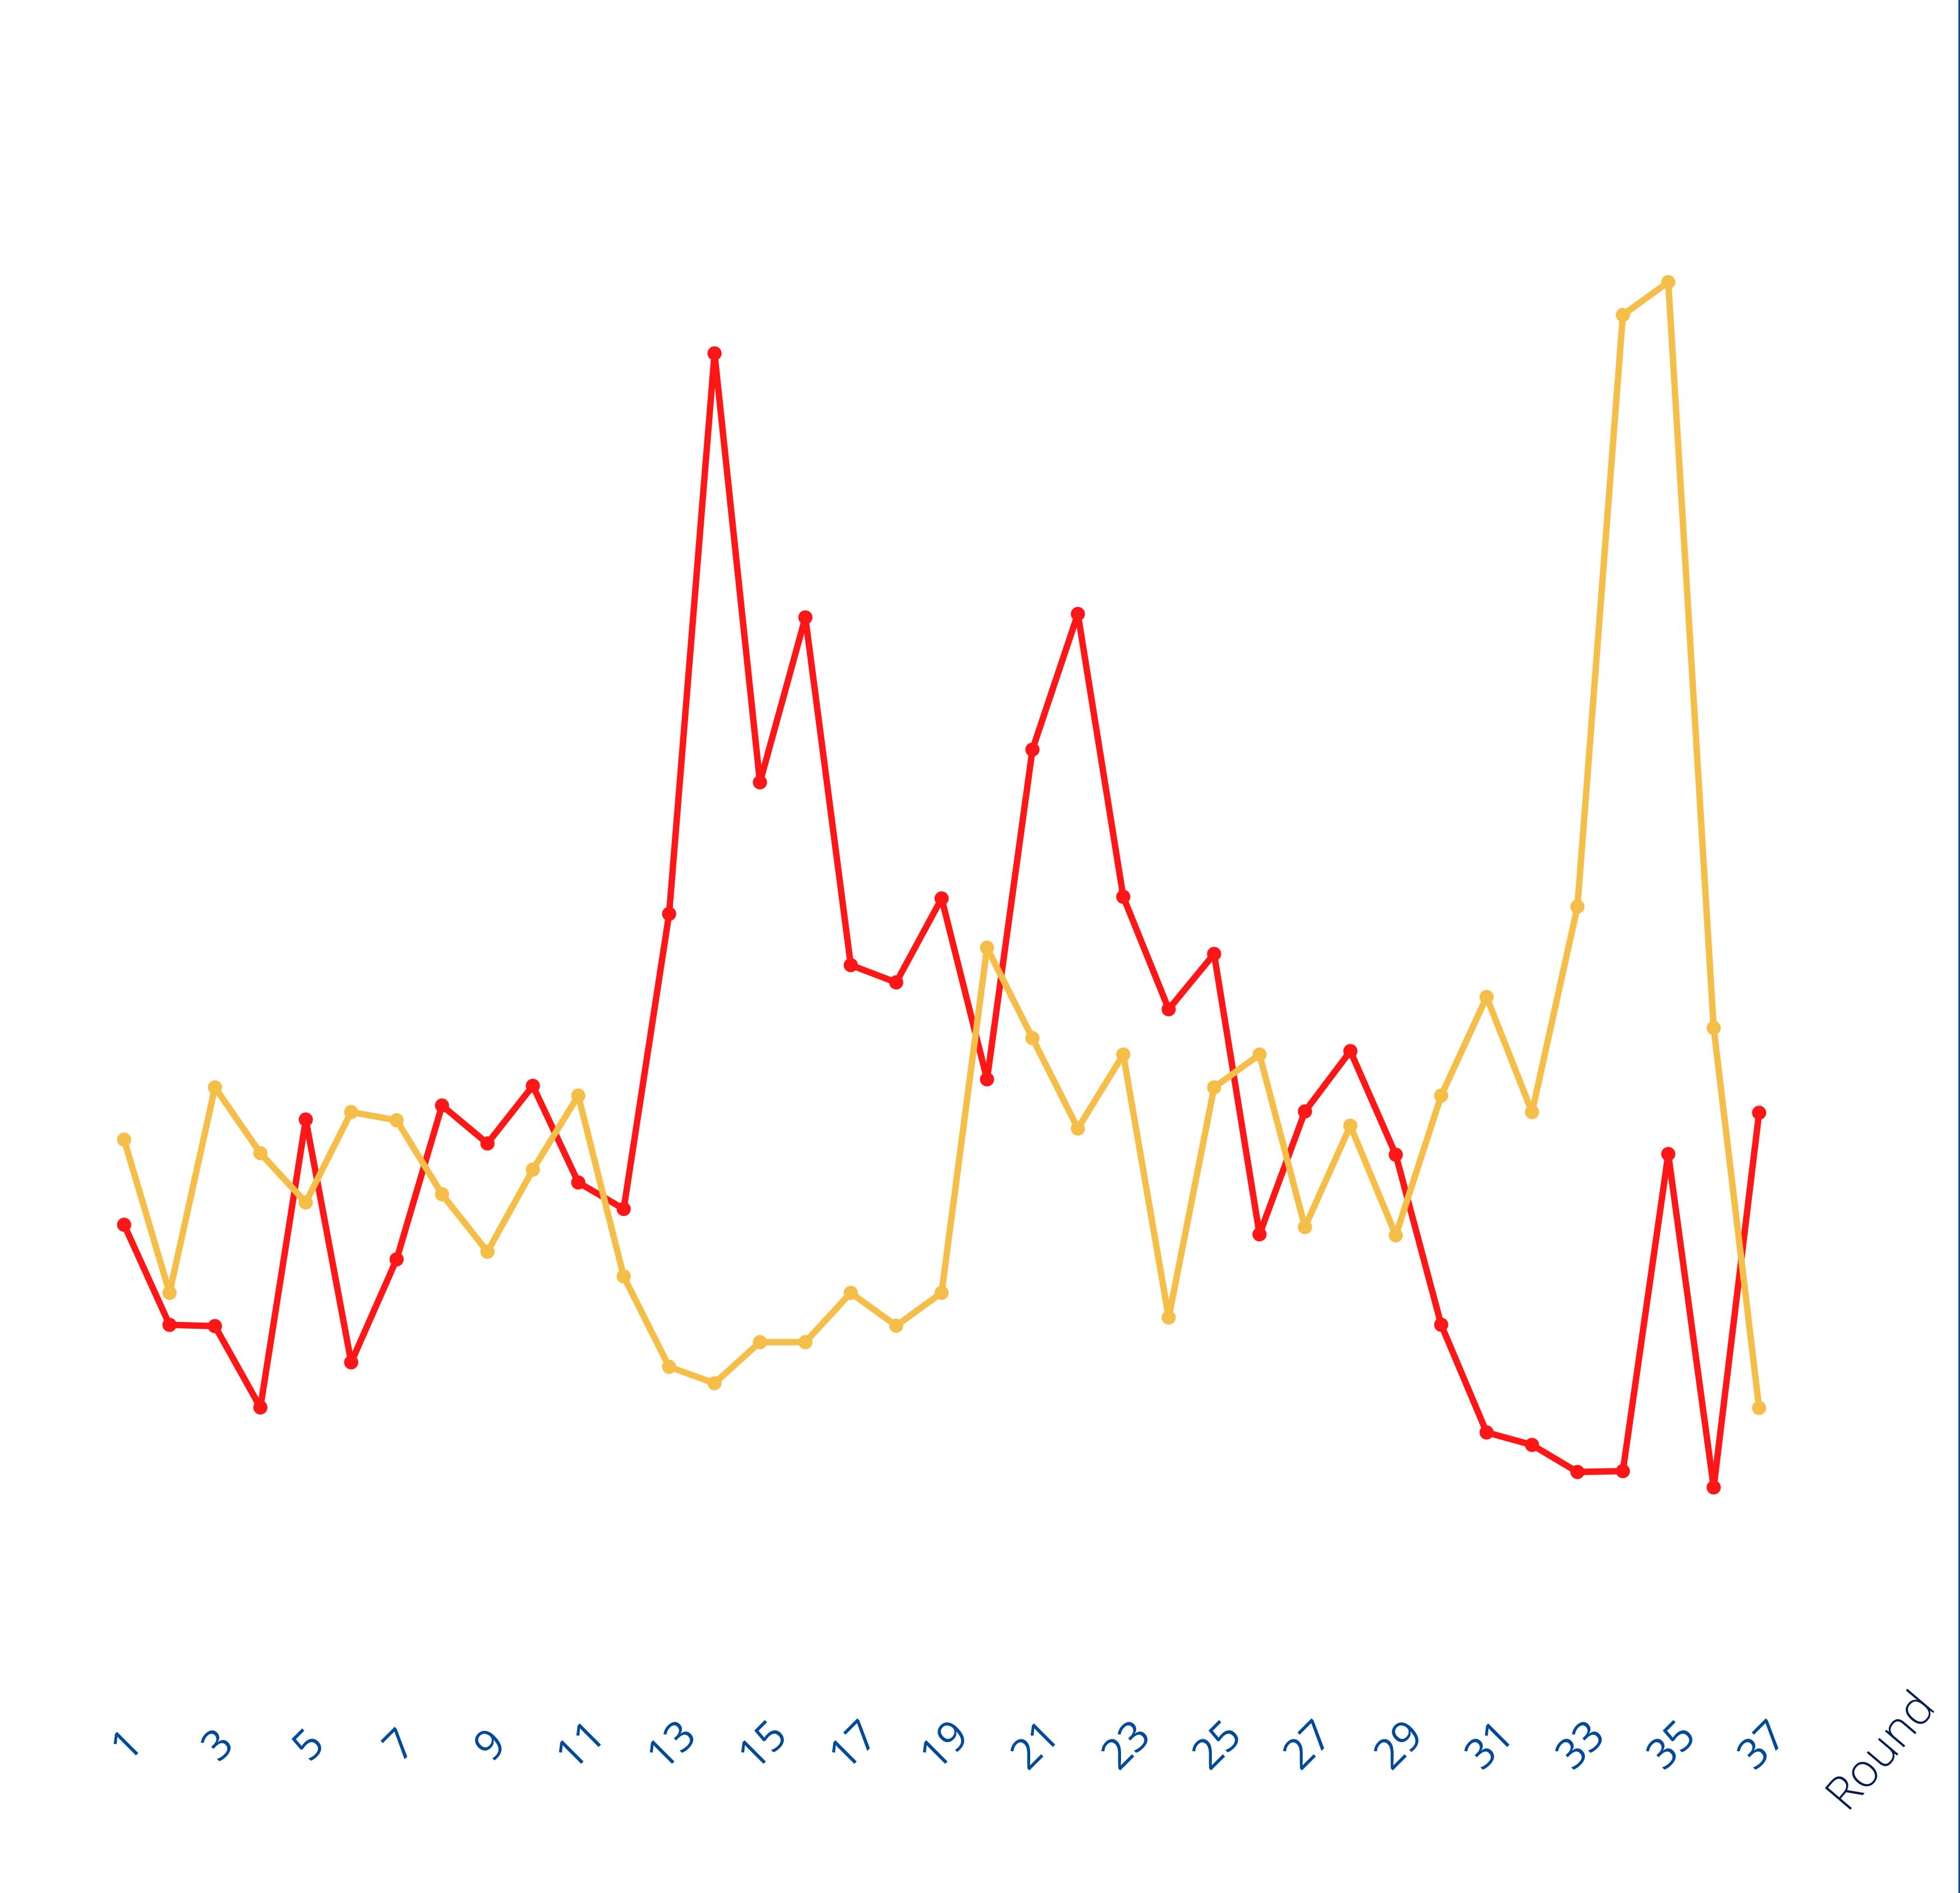
Voter turnout with transaction cost*
(average amount of ETH spent per transaction)
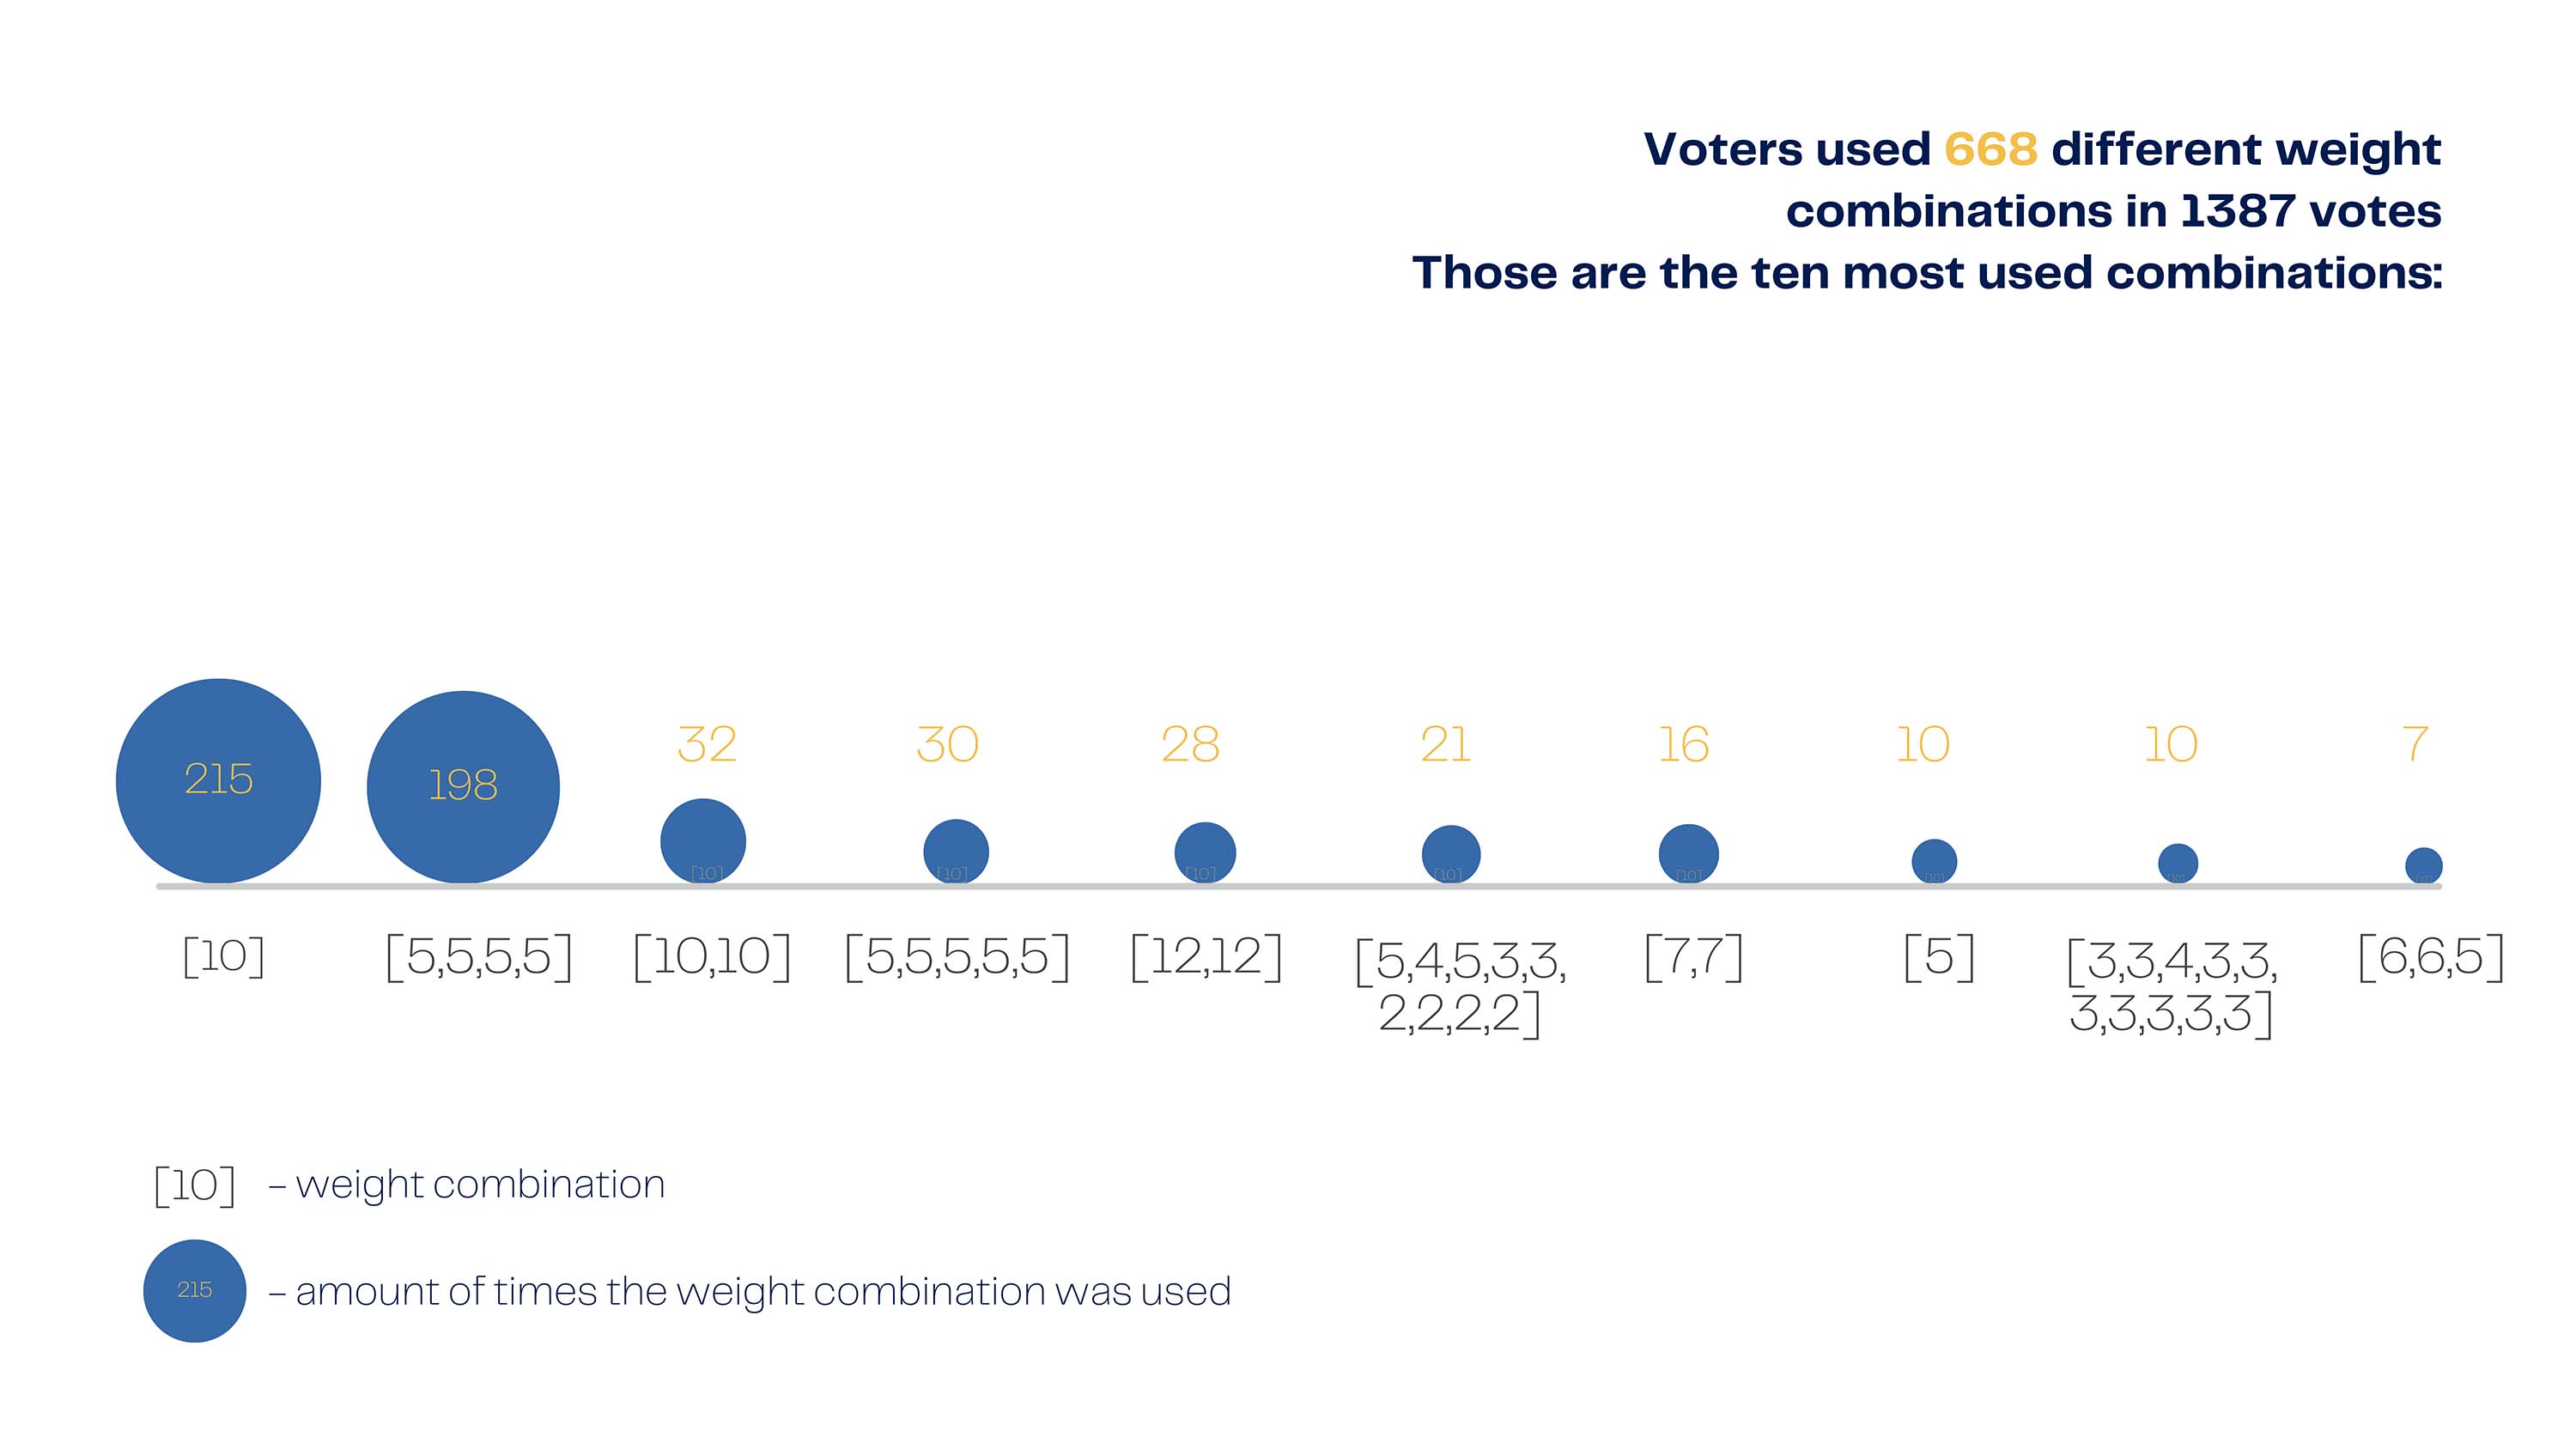
How did voter apply QV?

On average, voters used 72% of their voting power per vote.
100, 125, 97 were three most used amounts of voting power.
On average, voters made 5 choices per vote.
With 10, 4, 1 being the most used number of choices.
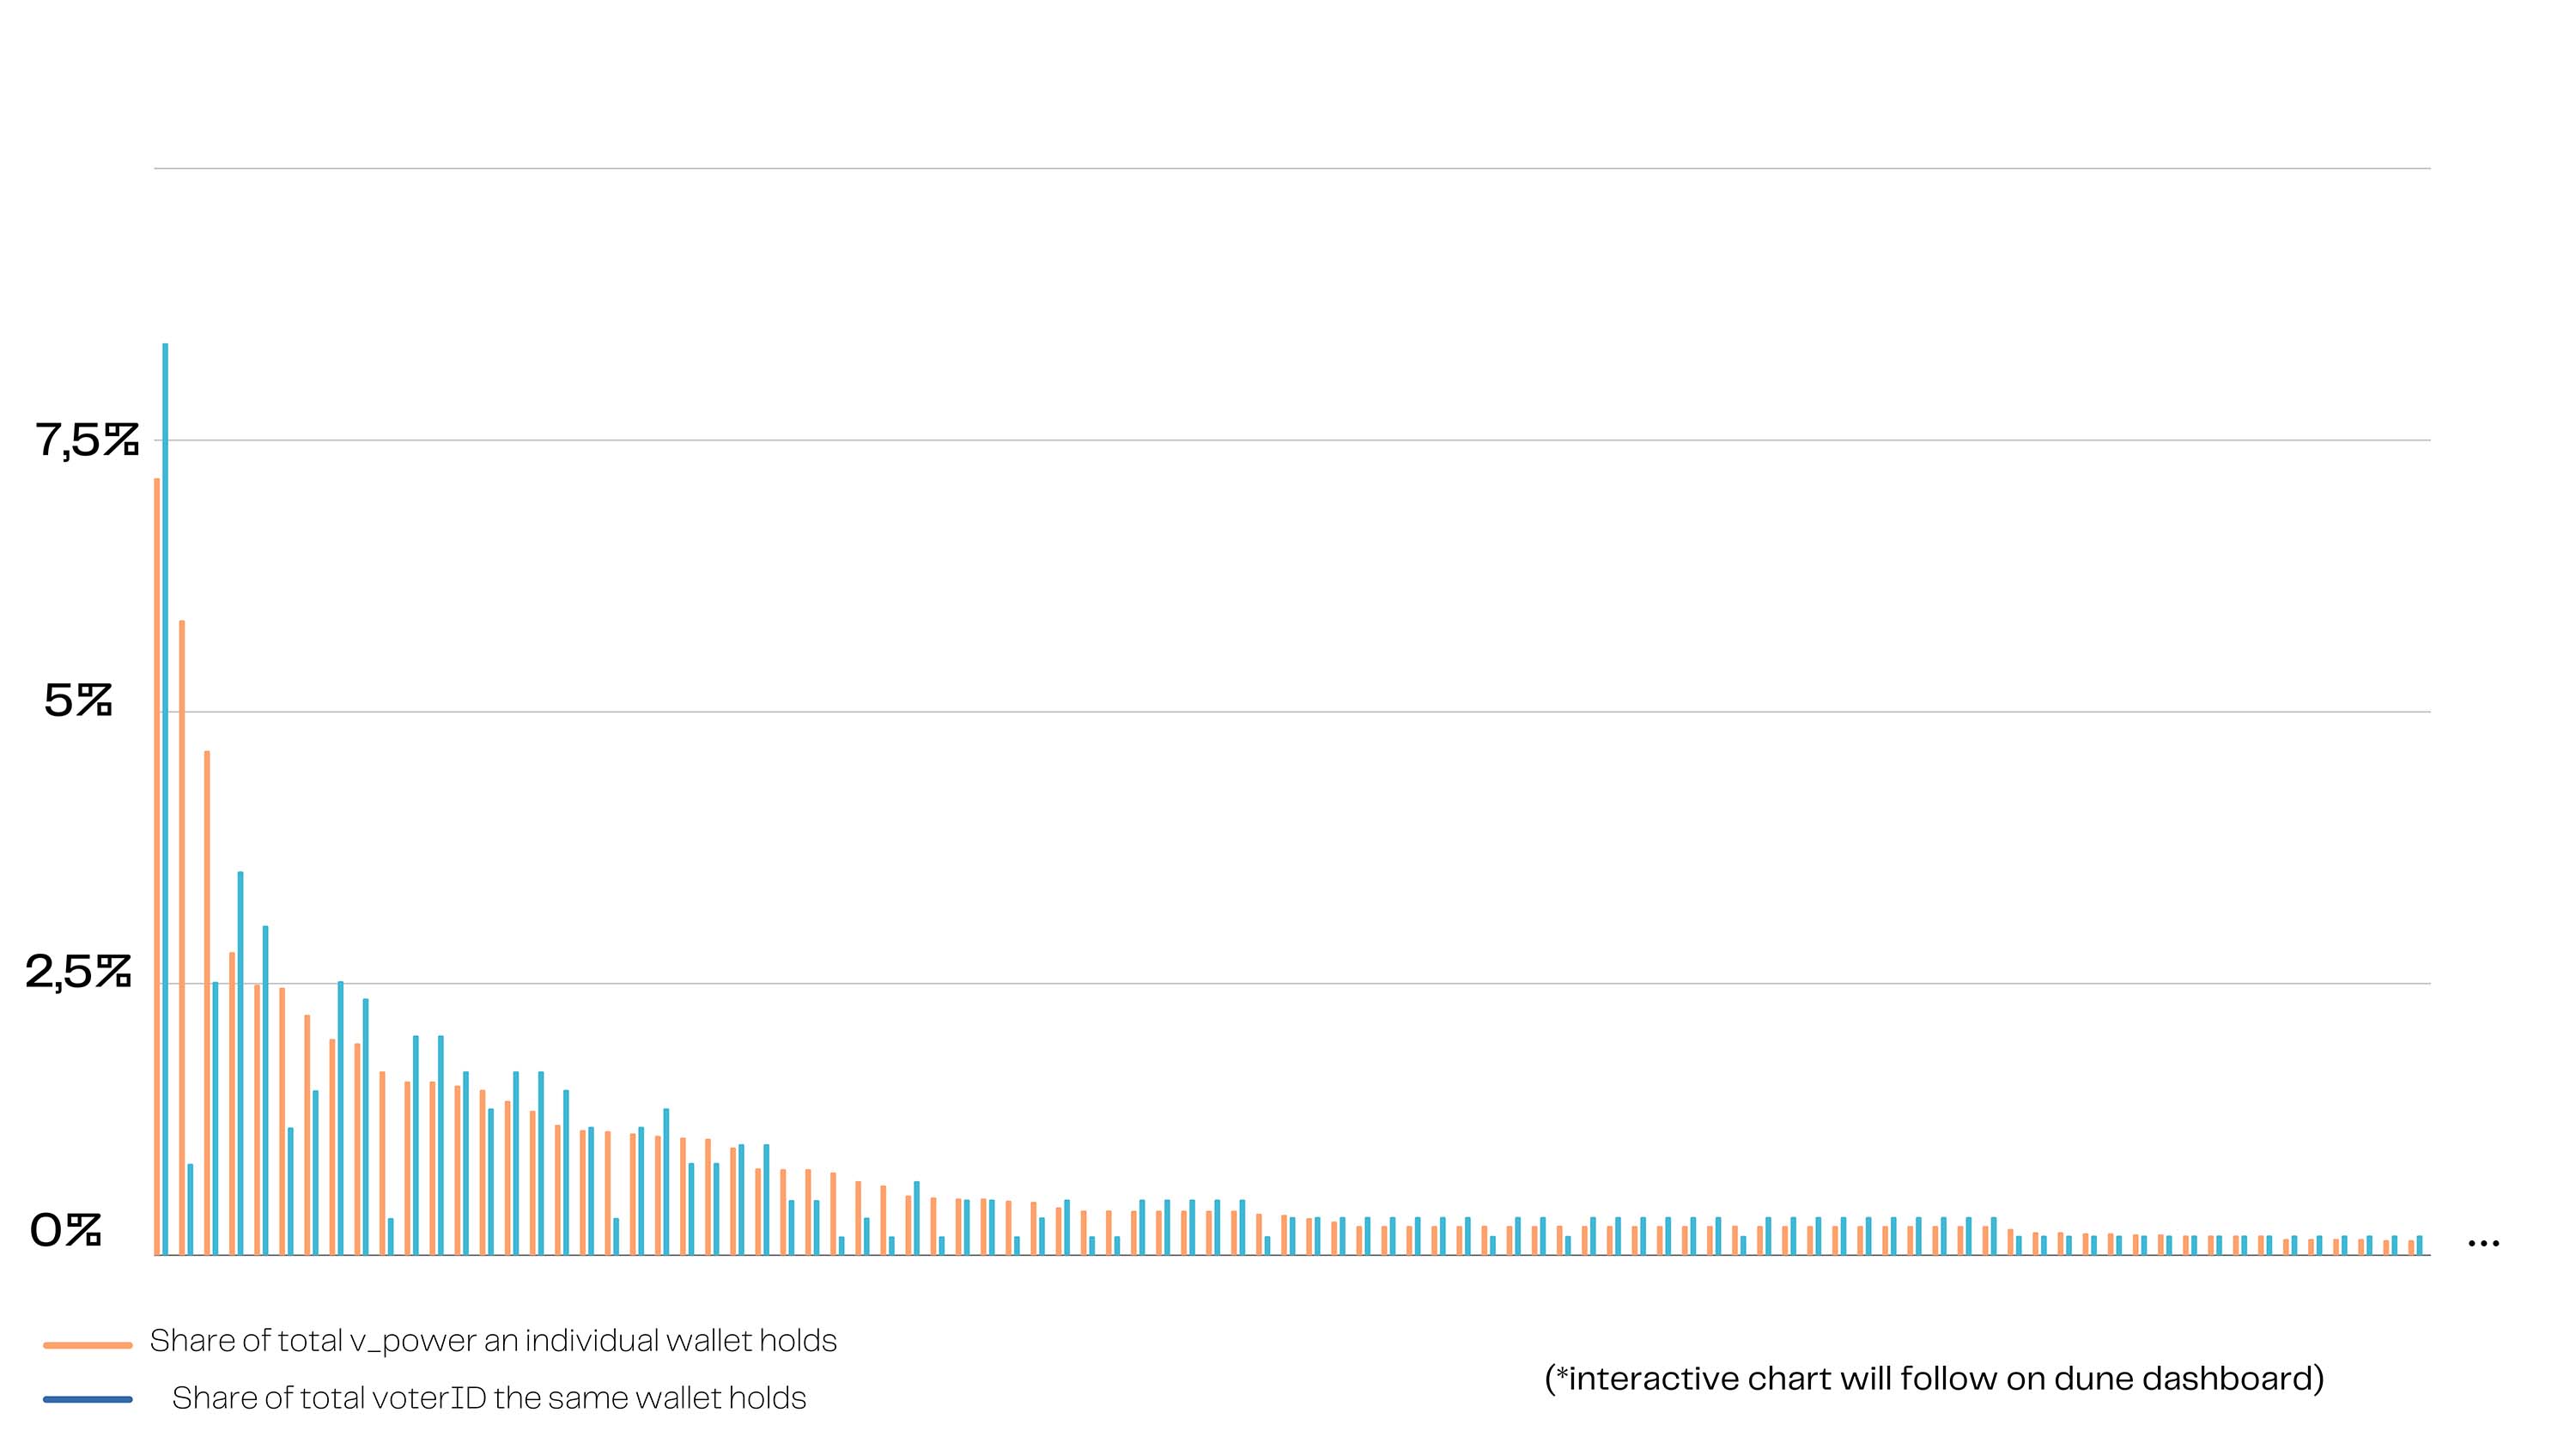
Coin clairvoyants
Top 3 wallets with most Voting Power |
|||
|---|---|---|---|
Address |
0x34…39EA |
0x6e…dDec |
0x67…e640 |
Voting Power |
5400 |
4406 |
3501 |
# of voterID |
50 |
5 |
15 |
# of rounds participated |
3 |
26 |
16 |
% of voting power used |
95.9% |
45.9% |
61.3% |
AVG # of choices |
4.1 |
3.7 |
9.9 |
3 most weight combination used |
[5,5,5,5] |
[10,10] |
[4,4,5,4,4,4,4,4,4,4] |
[5,5,5,5,5] |
[12,12] |
[4,4,4,4,4,4,4,4,4,4] |
|
[10] |
[3,3,4,3,3,3,3,3,3,3] |
||
Top 3 Voting Power Earners |
|||
|---|---|---|---|
Address |
0x6e…dDec |
0xDc…CA7D |
0xB3…6B7C |
Bought Voting Power |
500 |
200 |
100 |
Earned Voting Power |
3906 |
1074 |
469 |
% Increase |
781.2% |
537% |
375% |
How did the most successful voters used the vote markets? |
|||
|---|---|---|---|
# of rounds participated |
26 |
25 |
20 |
% of voting power used |
45.9% |
47.5% |
45.3% |
AVG # of choices |
3.7 |
5.8 |
9.7 |
3 most weight combination used |
[10,10] |
[5,5,5,5] |
[EACH VOTE A DIFFERENT COMBINATION] |
[12,12] |
[+48 DIFFERENT COMBINATIONS] |
||
[10] |
|||
Market predictions
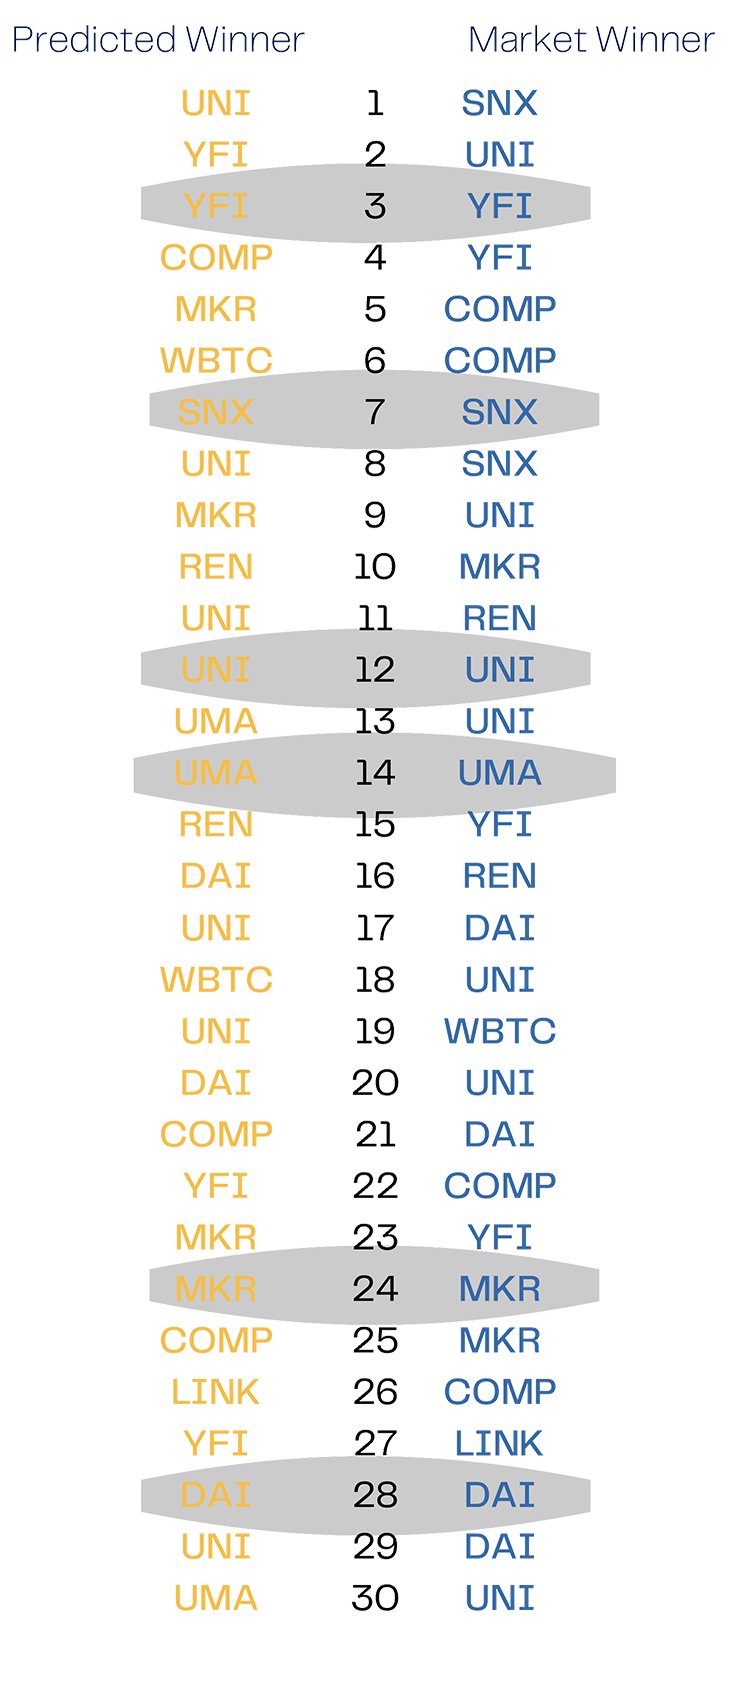
6 out of 30 coins were predicted successfully. Successful predictions were made in rounds 3,7,12,14,24,28.
There was no particular coin that was predicted more successfully than others.